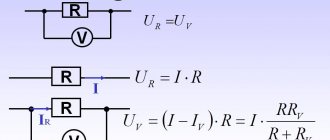
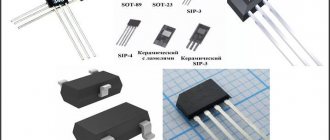
For the project we will need:
- analog current sensor ACS712;
- digital current sensor INA219;
- three-channel digital current sensor INA3221;
- Arduino UNO or other compatible board;
- any load, for example, a DC motor;
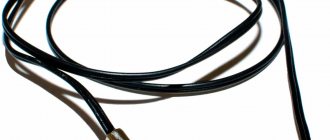
- connecting wires (for example, such a set of wires);
- bread board;
- personal computer with Arduino IDE development environment.
Current sensors, as their name suggests, measure current. There are sensors that are based on different physical effects and have different features. In particular, the ACS712 sensor under consideration is based on the Hall effect, the INA219 sensor includes an analog-to-digital converter (ADC), and the INA3221 sensor is three-channel. Let's look at them in order.
1Description of current sensor ACS712
The ACS712 current sensor is a sensor that is based on the Hall effect. The Hall effect is that when an electric current flows through a conductor placed in a magnetic field, a voltage arises in the conductor. This voltage serves as an indicator of current strength: it depends linearly on current strength. It also has a slight dependence on the ambient temperature and is influenced by external magnetic fields. So, for example, the graph below shows the dependence of the voltage at the output of the ACS712 sensor on the strength of the flowing current (for one of the types of sensor, more on that below) at different temperatures:
Dependence of voltage at the output of the ACS712 sensor on current strength
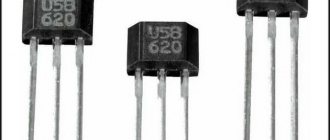
A module with an ACS712 sensor might look like this, for example:
Module with current sensor ACS712 and connection diagram
The ACS712 sensor has the following characteristics:
- works with direct and alternating current;
- current consumption – up to 13 mA;
- operating temperature -40…+85 °C.
There are several varieties of the ACS712 sensor, which differ in the amount of current measured. Thus, there are varieties with a maximum measured current of 5, 20 and 30 A. A wide range of measured current values can be attributed to the significant advantages of the ACS712 sensor. The listed modifications have a sensitivity of 185, 100 and 66 mV/A, respectively.
Android application for monitoring electricity consumption
You can use the Android app to monitor the described electricity consumption values and electricity bill. To do this, download the MQTT Dashboard android app from the Play store.
To connect to io.adafruit.com in it, follow the following sequence of steps.
Step 1 . Open the application and click on the “+” sign in it. Write any value you want in the Client Id field. Leave the server and port as shown in the following figure.
You can get the Username and Active key from the AdaFruit IO dashboard as shown in the following figure.
Step 2 . Select Electricity Meter and select Subscribe. To subscribe, enter a friendly name and topic in the format 'yourusername'/feeds/'feedname', then click create.
Step 3 . Similarly, subscribe to the value of your electricity bill (bill feed).
Step 4 . Once your devices start consuming electricity, the power consumption and electricity bills will be displayed in the application.
Thus, we have designed a smart electricity meter, thanks to which we can monitor our electricity consumption from anywhere in the world (where there is internet). Also on our website you can see other projects related to the Internet of Things category.
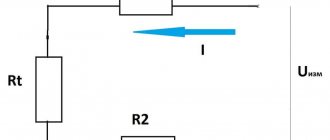
2Connecting the ACS712 current sensor to Arduino
As we remember from the school physics course, to measure current it is necessary to pass the current through a measuring device placed in the gap between the power source and the load. Accordingly, the sensor connection diagram is simple:
| ACS712 sensor output | Purpose |
| VCC | Power, 5 V |
| GND | Earth |
| OUT | Analog output of the sensor, the voltage on which linearly depends on the current flowing through the sensor |
| IP+ | Pin 1 for supplying measured current |
| IP | Pin 2 for supplying measured current |
The IP+ and IP- terminals are precisely the circuit break through which the current of interest needs to be passed. If you reverse the polarity, the measurements will have the opposite sign.
By the way, this feature - measuring current with both a positive and negative sign - allows the ACS712 sensor to be used for alternating current measurements.
Thus, to connect the ACS712 sensor to the Arduino board, 3 wires are used:
Connection diagram of the ACS712 current sensor to Arduino
We will connect the VOUT sensor output to any analog pin of the Arduino, for example, A0. We will use a DC motor as a load.
Module with ACS712 current sensor connected to Arduino, load – DC motor
Or, instead of a load, you can use a powerful incandescent lamp. Or any other load.
Module with ACS712 current sensor connected to Arduino, load – 10 W incandescent lamp
We will power the load from a laboratory current source, on which you can change the voltage and current.
Circuit operation
The circuit of an electricity meter based on ESP12 and Arduino is shown in the following figure.
For the ESP12/NodeMCU module the following connections must be made:
- connect the Rx pin of the ESP12 to the Tx pin of the Arduino board;
- Connect the Tx pin of the ESP12 to the Rx pin of the Arduino board.
NodeMCU (ESP12) does not have analog pins, so we used the serial communication port to communicate with this module. But this module works with voltages of 3.3 Volts, so in order not to damage it with the 5 V voltage from the Arduino pins, we used a voltage divider.
The output pin of the current sensor in the circuit is connected to the analog pin A0 of the Arduino board.
The appearance of the assembled circuit is shown in the following figure.
To control electricity consumption via the Internet, we used an MQTT broker implemented on the AdaFruit IO platform. To do this you need to do the following:
- Register an account on AdaFruit to store and read electricity consumption data.
- Create an Applet (application program) in the IFTTT service to generate messages using SMS/Email.
- Write program codes for Arduino and ESP12 Wi-Fi module.
All these processes are described in more detail later in the article.
3Reading ACS712 Current Sensor Using Arduino
In the sketch we will constantly read the value from port A0 and output it to the serial data monitor. Let me remind you that the ADC of different Arduino boards has different bit depth, usually 10 or 12 bits. Read more here. This means that values from 0 to 210 = 1024 can come from the analog port for a 10-bit ADC. Let's assume that we have a current sensor, the measurement range of which is from -5 A to +5 A, and the sensitivity is 185 mV/A.
If there are 185 mV per 1 A, this corresponds to approximately 38 ADC units: 185 1024/5000 = 37.888, (1) where 5000 is the maximum voltage value that the Arduino ADC can measure, in millivolts.
At the OUT output of the ACS712 sensor, in the absence of the measured current, there should be half the supply voltage, i.e. 2.5 V. Since the entire ADC scale lies in the range from 0 to 1024, then in the absence of a measured current we must read the number 512 from the Arduino analog port. This is the beginning of the reference scale. Let's denote it value_zero. The deviation of the current value_adc from the zero level up or down will show the current strength. Therefore, in order to calculate the current value in amperes from the ACS712 sensor, the difference
divide the zero level and the measured value from analog port A0 by 38. And to get the current in milliamps, you should multiply this value by 1000: I(mA) = (value_zero − value_adc) / 38 1000 (2)
Explanation of the principle of calculating current
In practice, the value at analog pin A0 will not be exactly 512. Therefore, to determine the reference point, we will add a primitive calibration to the sketch.
Calibration will consist of reading the value from analog port A0 a number of times in the absence of current on the ACS712 sensor, and averaging it. Naturally, the load must be turned off during calibration so that no current flows through the sensor. Sketch for measuring direct current with the ACS712 sensor (expandable) const int acs712_pin = A0; int zero; // zero level relative to which the current is measured, usually VCC/2 void setup() {
Serial.begin(9600);
calibrate(); } // determine the zero of the scale (before turning on the load) void calibrate(){
zero = 0;
int repeats = 10; for (int i=0; i int getCurrent(int adc) {
int delta = zero - adc; // deviation from zero scale float scale = 37.888; // how many ADC units are per 1 ampere, according to formula (1) int current = (int)delta*1000/scale; // count the current in mA and round to whole numbers, according to formula (2) return current; }
Let's upload the sketch and gradually begin to increase the voltage and current on the load. Let's wait for a while and then start reducing the current. As a result, we get something like this:
ACS712 sensor current output to serial monitor and its graph
As you can see, the analog signal is constantly “jumping”.
To avoid this, you should add anti-aliasing to your sketch. To do this, we will carry out several measurements in a row, and then take the arithmetic average of them as the actual value. At the same time, we will combine the initial calibration, because it works exactly the same way. Here's how the sketch will change as a result: Sketch for measuring direct current with an ACS712 sensor with smoothing const int acs712_pin = A0; int zero; // zero level relative to which the current is measured, usually VCC/2 void setup() {
Serial.begin(9600);
zero = getSmoothedValue(); // determine the zero of the scale (before turning on the load) Serial.print("Zero="); Serial.println(zero); } // gets the smoothed value from the Arduino ADC int getSmoothedValue(){
int value;
int repeats = 10; for (int i=0; i void loop() {
int sensorValue = getSmoothedValue(); // read the value from the ADC and output it to the monitor Serial.print(sensorValue); Serial.print(" = "); int c = getCurrent (sensorValue); // convert to a current value and output to the monitor Serial.print(c); Serial.println(" mA"); delay(100); } // calculates the current in mA from the value from the ADC
int getCurrent(int adc) {
int delta = zero - adc; // deviation from zero scale float scale = 37.888; // how many ADC units are per 1 ampere int current = (int)delta*1000/scale; // count the current in mA return current ; }
By the way, it is advisable to put the sensitivity of the ACS712 sensor into a constant at the beginning of the sketch so that you can quickly change the sketch to modify the sensor with a different measurement range.
The result of this sketch is a much nicer picture:
Smoothed graph of current measured by ACS712 sensor
The same principle is incorporated into the Arduino libraries that operate with the ACS712 current sensor. For example, this Troyka Current .
Based on the results of the experiment, it turns out that the ACS712 sensor is very simple, but at the same time quite inaccurate. Much more accurate is the current sensor, which we will look at in the next section.
4Description of current, voltage and power sensor INA219
The INA219 sensor is a digital current, voltage and power sensor. It can measure voltages from 0 to 26 volts and currents from 0 to 3.2 amperes. The sensor is powered with voltage from 3 to 5.5 V. There are modules that are completely ready for connection to Arduino. One such module is GY-219:
GY-219 module with INA219 current sensor: assignment of pins and parts
The INA219 sensor is available in two versions: A and B. The latter is characterized by increased accuracy and less error. The photo below is just a modification of INA219B.
GY-219 module with INA219 current sensor
The INA219 sensor has a 12-bit ADC, respectively, with a maximum measurement of ±3.2 A, a resolution of 0.8 mA is obtained. However, you can configure the sensor to reduce the current range measured to ±400 mA; in this case, the resolution of the sensor will increase to 0.1 mA. In this case, you can calibrate the sensor by writing calibration data to a special register. The measured current, voltage and capability data are stored in three corresponding registers. By the way, the INA219 sensor allows hardware filtering using 128 counts if the measured current has strong interference.
The INA219 sensor is configured and read using the I2C serial interface. Moreover, the address on the bus can be set using jumpers A0 and A1 on the module. Valid addresses:
- 0x40 (no jumpers);
- 0x41 (with jumper A0);
- 0x44 (with jumper A1);
- 0x45 (both jumpers are installed).
Accordingly, on one IIC bus you can have up to 4 such sensors connected simultaneously.
5Connecting the INA219 current and voltage sensor to Arduino
To begin with, let's take the simple route: download the ready-made library, load it into Arduino and look at the result. There are several libraries for working with our sensor. I suggest using this popular library for INA219 from Adafruit. Let's download it, install it in the standard way and upload the sketch from the getcurrent examples to Arduino.
If the sketch does not compile, and the error messages contain some missing components (for example, Adafruit_I2CDevice.h or Adafruit_BusIO_Register.h), then you need to install them. The easiest way to do this is this way. This method requires an Internet connection on the computer where you are running development environment.Open the library manager in the Arduino IDE: in the Tools Manage Libraries... menu. The Library Manager window will open. In the search field, enter adafruit busio ... When the library is detected and appears in the list, click the Install button.
Installing missing libraries through the Arduino IDE library manager
Let's connect the GY-219 module to Arduino according to the following diagram. The SDA and SCL of the sensor can be connected either to the analog inputs A4 and A5 of the Arduino, or to dedicated SDA and SCL ports (if your board has them).
Connection diagram of the INA219 sensor to Arduino
The load can be any source, for example, an electric motor, a lamp, or simply a powerful resistor. I have 5 5-watt 16-ohm resistors connected in parallel. Any of your existing sources can also serve as a power source. I will be using a lab power supply.
INA219 sensor connected to Arduino
The result of running the sketch will be the following output:
The result of the “GetCurrent” sketch for the INA219 current sensor
Great! Everything is working! As they say, take it and use it.
This library also allows you to calibrate the INA219 sensor if necessary. Details are in the description of the library and in the source code itself (a large number of explanations are given in the Adafruit_INA219.cpp file of the library).
Creating an application program in IFTTT for sending SMS/Email
Step 1 . Register in the IFTTT service or log in if you already have an account there.
Step 2 . On the My Applets tab, click New Applet.
Step 3 . Click on +this.
Step 4 . Find AdaFruit and click on it.
Step 5 . Click on “Monitor a feed on AdaFruit IO” (monitor the feed in AdaFruit IO).
Step 6 . Select the bill as the Feed, select the Relationship as 'equal to' and enter the limit (we entered 4) upon reaching which you will be notified by E-mail. Click on Create action.
Step 7 . Click on +that. In the search, enter G-mail, then click on it and log in with your g-mail details.
Step 8 . Click on send yourself an email.
Step 9 . Write down your subject (topic) and its description (body) as shown in the figure and click on create.
Step 10 . Your notification has been created. Watch it and click on finish.
We are done with the integration of our project into the Internet, now we can move on to writing the program code.
6How to read INA219 current and voltage transmitter data
If you look at the data exchange on the I2C bus that occurs when this sketch is running (using a logic analyzer, of course), we will see the following.
Oscillogram of reading the registers of the INA219 sensor
To understand what's going on here, you need to look at the register map of the INA219 sensor.
The sensor contains only 6 registers. All registers are 16-bit. INA219 Current and Voltage Sensor Register Map
| Register address | Register name | Purpose of the register | Type |
| 0x00 | Configuration | Reset all registers, adjust measurement range, PGA gain, ADC resolution and filtering. | Read/Write |
| 0x01 | Shunt voltage | Stores the measured voltage value across a 0.1 ohm shunt resistor. | Reading |
| 0x02 | Bus voltage | Stores the measured bus voltage value. | Reading |
| 0x03 | Power | Stores the measured power value. | Reading |
| 0x04 | Current | Contains the value of the current flowing through the shunt resistor. | Reading |
| 0x05 | Calibration | Calibration register. Sets the measurement range and allows system calibration. | Read/Write |
To exchange with the module, we will use a debug board with an FT2232H chip and the SPI via FTDI program. It will be easier than using Arduino, because... To make changes for experimental purposes, you will not have to reprogram the ROM each time, but it will be possible to make changes to the transmitted commands on the fly. Let's connect the sensor to the 3.3 V power supply and to ground, taken from the Arduino. And we will connect the SCL and SDA pins to the ADBUS0 and ADBUS1+ADBUS2 pins of the board with the FTDI chip, respectively.
Reading INA219 Current Sensor Registers Using FT2232H
Let’s launch the SPI via FTDI program and select the I2C interface in the “Device” menu. Let's connect to port A. Let's scan devices on the I2C bus. The program will find the device at address 64 (0x40), unless of course you changed the address with jumpers A0 and A1. Let's select this device. In the “Reading” section, set the buffer size to 2 bytes, write the command 00 and click the “Read” button. The read data will be in a table, which opens by clicking on the button with the table icon. This is what we will see.
Reading registers of the INA219 current sensor using FT2232H and the “SPI via FTDI” program
As you probably already guessed, the “0” command means the address of the register from which we want to read data. And the number 0x399F is the data in register zero (configuration register). And this corresponds to the documentation, because. After turning on and booting, the INA219 chip has exactly this default configuration. This is the structure of the configuration register.
Structure of the INA219 current sensor configuration register
The INA219 sensor configuration register contains the following parts:
- RST (reset) – reset;
- BRNG (bus voltage range) – bus measurement range;
- BADC (bus ADC resolution/averaging) – resolution of the bus ADC;
- SADC (shunt ADC resolution/averaging) – resolution of the shunt ADC;
- MODE – mode;
- PG – PGA gain and range.
0x399F in binary is "001_11_0011_0011_111". Therefore, the default values after enabling are as follows.
- BRNG is equal to "1", which means the measurement range is 32 volts FSR;
- PG is equal to “11”: sets the range to ±320 mV and the gain to 8;
- BADC, SADC are equal to “0011”: the maximum resolution of the ADC is 12 bits;
- MODE equal to “111” means continuous operation, both the shunt and the bus are turned on.
To read other registers, you must first also write their address in the “Read” “Command” field, and then read 2 bytes. Or you can write the register number in the Write Command field and then just read (without specifying the register address in the read command).
Unfortunately, sequential reading of all registers of the INA219 microcircuit “in one pass” is not provided.
Let's return to our oscillogram. We see 6 reading cycles on it (each starts with a green dot ● and ends with a dark red dot ●). First we read the register with the shunt voltage Vshunt. (address 0x01), which stores the value 0x1957. Next, we read the value of the Vbus bus voltage register (0x02), in which the value is 0x19BA. Next we read the calibration register Cal (0x05) with the value 0x1000. Then the shunt current register Ishunt. (0x04), in which the value is 0x1959. Then we read the calibration register Cal (0x05) again. Finally, we read the power register Pwr (0x03), which contains the value 0x042B. The serial port monitor shows the following:
Port monitor output at the time of taking an oscillogram from the INA219 sensor
Let's look at how to bring data in registers “into human form.” We are not interested in all values, but only in voltage and current. Plus a calibration register, which plays the role of a correction factor.
Shunt Voltage register (address 0x01) of the INA219 sensor
The voltage on the shunt is equal to the value written in the register, divided by 100: Ushunt = Shunt_voltage/100 = 0x1957/100 = 64.87 (mV) For cases where the voltage is negative, the calculation is somewhat more complicated. This can be found in the technical description (datasheet).
Bus Voltage register (address 0x02) of the INA219 sensor
Let's start with the register in which the bus voltage is recorded, because it's the simplest. Currently the data in it is 0x19BA. According to the same technical description (datasheet on INA219), to convert the value to millivolts, you need to do the following: Ubus = (0x19BA >> 3) × 32000 (mV) / 8000 = 3292 (mV).
Here 0x19BA is the value in the register. It needs to be shifted 3 digits to the right, because Voltage data is stored starting from the 3rd digit. 32000 (mV) is the limit of the measurement scale (it is indicated in the configuration register). And 8000 is the limit of the measurement scale in counts. It turns out 3292 (mV) or 3.29 volts, which is what we see in the output of the sketch in the Arduino port monitor.
Current Register (address 0x04) of the INA219 sensor
The current value is also easy to calculate: I = 0x1959 × 0x1000 / 4096 = 6489.
The value in the shunt voltage register 0x1959 is multiplied by the value of the calibration register, which in our case is 0x1000. And then the result is divided by 4096 (which, by the way, is the same as 0x1000). That is, the current is equal to 6489. But in what units? To answer this question, you need to define the Current_LSB parameter: Current_LSB = 0.04096 / 0x1000 / 0.1 (Ohm) = 0.0001 Here 0x1000 is the value of the calibration register, 0.1 (Ohm) is the shunt resistance, and 0.04096 is just a coefficient. Now the calculated current needs to be multiplied by the number Current_LSB, and we get 0.6489 (A) or 648.90 (mA). We see such a current in the monitor.
Power register (address 0x03) of the INA219 sensor
Power is calculated as the product of bus voltage and current: P = Ubus × I = 3292 (mV) × 648.9 (mA) = 2136 (mW)
The slight discrepancy with the Arduino monitor output is due to a rounding error. Namely, if we look at the output of the port monitor, we will see that the voltage value on the bus is assumed to be 3.29 V, while the register is written at 3.292 V. Because of this, the calculated value is 2 milliwatts larger than that shown in the output of the sketch.
Registering an account in AdaFruit
Here you need to follow the following steps:
Step 1 . Register an account on Adafruit IO or log into your account if you are already registered there.
Step 2 . Click on My account -> Dashboard.
Step 3 . Click on Actions and create a new Dashboard.
Step 4 . Enter a name and title for your project and click Create.
Step 5 . Click on the Key button (the button with the image of a key - see the picture) and write down the keys that this service will provide you (see the picture). Further, these keys will be used in the program code.
Step 6 . Click on the '+' button to create a new block and click on the Gauge to display the power consumption level. You can use a simple text field to display this information.
Step 7 . Next, enter the Name of Feed and click on Create. Then select the feed and click on Next step.
Step 8 . In the block settings, enter the minimum (in our case 0) and maximum values (in our case 100). You can change these entered values later.
Step 9 . Your view for electricity metering (Power feed) has been successfully created. Now create a feed to display the bill by clicking on the “+” button.
After this, you will need to establish a connection with AdaFruit IO to transfer SMS/E-mail using the IFTTT service.