Based on materials from the article “Power quality indicators measurement in real distribution network”. Author: Velimir Strugar, certified engineer, master of electrical engineering, Montenegrin Electrical Enterprise, Electricity Distribution Department
The article provides information on the influence of various devices operated in the distribution system of the Montenegrin Electric Enterprise, or more precisely, the distribution network in the city of Tivat. Measurements in Tivat were carried out for more than a year (from April 16, 2004 to the end of July 2005).
Quick navigation through the article:
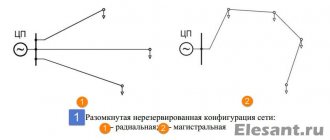
1. Introduction 2. What is power quality? 2.1. Origin of higher harmonics in the electrical network 2.1.1. Sources of harmonic disturbances 2.1.2. Impact on customer equipment 3. Methods for measuring power quality 4. Results for the control point “high-voltage line “Lepetan” 10 kV” 5. Results for the control point TS 10/04 kV “Selyanovo B” 6. Results for the control point TS 10/04 kV "Selyanovo SIZ" 7. Results for the control point of the TS 10/04 kV "Plavda" 8. Simulation model 9. Equipment for power quality analysis 10. Conclusion
Introduction
In this article we analyzed some control points in the distribution network of the city of Tivat in the Republic of Montenegro. The results of the point data analysis are also presented here. To begin with, we can look at the results for a control point called the high-voltage line “Lepetan” 10 kV. The measurement process covered the secondary currents and voltages of the current and voltage instrument transformers, these values were recorded and analyzed. The measurement results were processed and presented in MS Excel.
In this case, the following measuring equipment was used: a hand-held analyzer “FLUKE 430” and a device for continuous recording of measurement data “Power Quality Analyzer MI 2192”. After taking measurements, when the problem was confirmed, the water supply and sewerage organization had to take action, since it is they who are the main culprit for the fact that the results do not meet the requirements.
The obtained measurement results sometimes exceeded the limit provided by the standards (EN 50160). The excess occurred when the pumps were started. The actual data formed the basis for the development of the simulation model. The resulting model was used to develop a filter to suppress parasitic harmonics in electrical networks. The results of applying the filter are presented. Fortunately, the water supply company installed a passive filter to compensate for the associated harmonics.
Purposes of the audit
The results obtained make it possible to achieve compliance with the parameters specified in the supplier’s contract. The analysis provides data for drawing up a detailed report on the operation of the system. The examination reveals a list of deviations or their absence. The received document provides grounds for presenting justified claims to the supplier about the non-compliance of energy quality with generally accepted standards. As a result, the second party to the contract will eliminate all problems and identified violations within a specified period of time.
The measurements provide the calculation of the efficiency factor for the use of electricity. Thanks to this, production reaches a technological level of operation with minimal consumption of resources. If necessary, objects that operate inefficiently or to the detriment of the entire system are removed from the electrical network.
It is worth conducting research for real and planned energy supply systems. The examination is timed to coincide with the energy audit of the industrial facility. The results of the audit provide data for increasing the level of energy efficiency in the industrial sector.
The obtained values are saved and used during the next audit. Experts compare the data and draw appropriate conclusions about the operation of the system.
What is power quality?
There are many definitions of power quality, depending on one's perspective. A simple definition accepted among most customers is that power quality is good if the appliances connected to the power supply operate satisfactorily. Typically, poor or low quality power supplied will result in the computer needing to be rebooted several times, sensitive devices locking up, lights flickering, electronic drives and test equipment not functioning properly. On the other hand, for utility grid companies, power quality is determined by voltage parameters that affect sensitive equipment.
Another definition of power quality is based on the EMC principle and is as follows: The term “power quality” refers to a wide range of electromagnetic phenomena that characterize the voltage and current at a certain point in time at a certain point in the power system (IEEE 1159:1995 IEEE Guidelines for Monitoring Power Quality ").
IEC 61000-4-30 "Test and measurement methods - Methods for measuring power quality" (in preparation) defines power quality as "the characteristics of electricity at a specific point in an electrical system, compared with a set of reference technical parameters." We can describe the level of power quality by the values of harmonic distortion coefficient THDU, THDI and other parameters based on the higher harmonics of voltage and currents.
Origin of higher harmonics in the electrical network
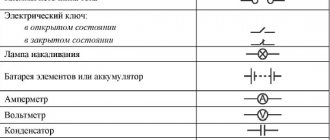
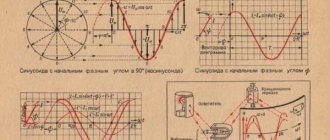
Figure 1 explains the principle of harmonic generation in electrical networks. From the user's perspective, the power supply network can be thought of as a generator G and a design impedance Xs. The generator voltage is considered to be a pure sine wave voltage with a nominal rms value.
The voltage at the consumer connection points differs from the generator voltage due to the voltage drop across the calculated impedance. In the case of a linear load (this example uses a resistor, but this example is suitable for any RLC combination) the current and subsequent voltage drop will also be sinusoidal. The voltage accumulated at the connection points will be purely sinusoidal with a reduced amplitude and phase shift to the generator voltage.
Figure 1. Principle of formation of harmonics in electrical networks
Non-linear loads (rectifiers, variable frequency drives, fluorescent lamps, PCs, TV...) consume current with a high THDI (non-sinusoidal waveform). For analytical purposes, nonlinear loads can be modeled with linear loads and a harmonic (current) source. Current harmonics cause a non-sinusoidal voltage drop across the design impedance and distorted voltage at the power terminals. Non-linear loads distort the supply voltage in such a way that only the odd harmonics can be detected by the meter. If the load is controlled asymmetrically, the positive and negative half-cycles of the current differ in shape and RMS value, resulting in even harmonics and DC current components. This situation leads to saturation and overheating of the magnetic systems of transformers. In some regions, significant DC current components may appear as a result of geomagnetic storms.
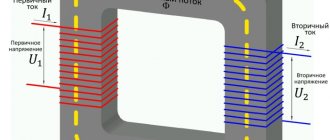
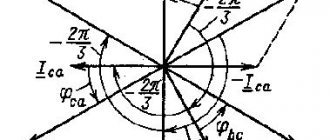
Another source of harmonics is the power supply network itself. Magnetization of the transformer magnetic system and its saturation cause non-sinusoidal currents, which appear as harmonic distortion factor THDU at the power terminals. Figure 2 shows how a harmonic disturbance propagates. The voltage waveform at a specific measurement point is distorted by the current generated by all the noise generators (frequency converters, welding machines, PCs, power transformers...) in the system.
Figure 2. Propagation of harmonic disturbance
Harmonic sources:
- single-phase rectifiers - 3rd harmonic, THDI 80%;
- three-phase loads - 5th, 7th, 11th, 13th, 17th harmonics;
- single-ended controlled power supply - even harmonics and direct current;
- the number of pulses is higher - the THDI coefficient is lower;
- series inductance reduces THDI;
- low-voltage power supply network - THDU coefficient 1.5 ÷ 4.5%, mainly the 5th harmonic.
Impact on customer equipment:
- overall energy efficiency decreases;
- premature wear of system components;
- triple harmonics can create high current in the neutral line, leading to overheating and losses;
- increased heating, noise and vibration in transformers and motors;
- the current in the capacitor bank increases with the harmonic order, causing malfunctions;
- the presence of a harmonic increases the likelihood of resonance;
- problems with signal frequencies;
- automatic shutdown of safety devices;
- If the THDU ratio rises above 8%, the failure rate of electronic drives and switches increases.
Determining the possibilities for connecting additional loads
In electrical projects for shops, offices, workshops and other structures with a uniform load distribution throughout the system, it is quite easy to determine the possibility of increasing the load. To do this, it is enough to measure the current at the input circuit breaker with special clamps and draw the appropriate conclusions based on the data obtained. The results of such electrical measurements can be considered quite accurate, unless we are talking about really large objects with an extensive electrical system.
If it is necessary to connect additional machines or units in production, then the measuring work will be significantly complicated by the accepted rhythm of operation of other installations connected to the electrical network. Here it will not be possible to get by with a simple measurement using electric clamps and a full-scale test will be required, including measuring peak powers at the site over a certain time.
Example of a technical report
Back
Forward
Below you can use the online calculator to calculate the cost of electrical laboratory services.
Methods for measuring power quality
Methods for measuring power quality are based on digital processing of input signals. Each input signal (3 voltages and 3 currents) is sampled 128 times in each input cycle. The duration of this input cycle depends on the frequency of the clock input (one of the three voltage inputs or the current input). At 50 Hz, the input cycle period is 20 ms. Basic measured values are calculated at the end of each sampling period and the results are displayed or recorded. Results based on Fast Fourier Transform (FFT) are calculated only every 8th input cycle (every 160 ms, 50 Hz). The following equations are used to calculate these quantities.
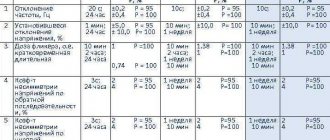
Table 1. Basic calculations
Table 2. Additional calculations (using basic values)
Table 3. Additional calculations (using FFT)
Table 4. General values
In 3ϕ systems with a conventional 3-wire connection, the following values are not available for display or recording:
- current in the neutral conductor;
- voltage-current phase angle;
- phase power factor.
Voltage surge measurements: according to IEC/61000-4-15.
Results for the control point “high-voltage line “Lepetan” 10 kV”
The 10 kV Lepetan high-voltage line supplies electricity from several 10/04 kV transformer substations to very different loads: agricultural complexes, administrative buildings, apartment buildings, schools, kindergartens, supermarkets, warehouses, water supply and sewerage organizations, barracks, etc. One of the 10/04 kV transformer stations discovered a problem with power quality, since one of the consumers had a very non-linear current waveform. This is a 10/0.4 kV transformer station called “Plavda”. A nonlinear consumer is a water supply station equipped with a pump with powerful asynchronous motors. This particular measurement at the control point of the 10 kV Lepetan high-voltage line was carried out from March to July 2005. Figure 4 shows the location of the transformer substation of the high-voltage line under consideration.
Figure 4. Location of the transformer station of the 10 kV Lepetan high-voltage line
The total length of the Lepetan high-voltage line is about 1.4 km. The following figures show voltage and current waveform diagrams and harmonic spectra.
Figure 5. Voltage waveform of the high-voltage line 10 kV “Lepetan”
Figure 6. Harmonic voltage spectrum of the 10 kV Lepetan high-voltage line
Figure 7. Current curve shape of the high-voltage line 10 kV “Lepetan”
Table 5. Electricity quality indicators of the 10 kV Lepetan high-voltage line
Figure 6 shows the harmonic spectrum of voltages with a predominance of the 5th and 7th voltage harmonics. The greatest influence on the THDU coefficient, if we consider the state of power quality at the beginning of the Lepetan high-voltage line (on the 10 kV electrical bus in the 35/10 kV Tivat TS), was exerted by the 5th voltage harmonic. The main culprit for this level of the 5th harmonic was the water supply and sewerage organization connected to the 10/04 kV Plavda TS. This problem was resolved after the local water supply company in the city of Tivat installed the correct equipment to eliminate high-order harmonics in electrical networks.
Table 6. Numerical values of power quality components
The main performance characteristic of the Lepetan high-voltage line was poor power factor (Table 5). The frequency was within acceptable limits. Table 6 presents the numerical values of power quality for the voltages and currents of the components of the Lepetan high-voltage line.
Mandatory requirements
In accordance with Federal Law No. 35 “ On Electric Power Industry ”, subjects of the electric power industry that ensure the supply of electrical energy to consumers of electrical energy, including energy sales organizations, guaranteeing suppliers and territorial network organizations (within the limits of their responsibility), are responsible to consumers of electrical energy for the reliability of the supply their electrical energy and its quality in accordance with technical regulations and other mandatory requirements.
In accordance with the “Basic provisions for the functioning of retail electricity markets (approved by Decree of the Government of the Russian Federation dated 04/05/2012 No. 442) ” : electric power industry entities providing electricity supply to consumers, including suppliers of last resort, energy sales (energy supply) organizations, network organizations, system The operator and subjects of operational dispatch control in technologically isolated territorial electric power systems, as well as producers of electrical energy (capacity), in the course of fulfilling their obligations under contracts concluded by them on the wholesale market and retail markets, jointly ensure in retail markets the reliability of supply to consumers and the quality of electrical power. energy . Requirements for the reliability of power supply and the quality of electrical energy are established in accordance with the legislation of the Russian Federation.
These provisions define the responsibility of both the electric power industry entities that ensure the supply of electrical energy to consumers, and consumers, in the form of mandatory inclusion of essential conditions in contracts for the sale (supply) of electrical energy (power):
- requirements for the quality of supplied electrical energy, which must comply with the requirements of the legislation of the Russian Federation;
- the consumer’s obligation to maintain, at the balance sheet boundary, the values of electric energy quality indicators determined by the operation of his power receiving devices, in accordance with the requirements of the legislation of the Russian Federation, to comply with the values of the ratio of active and reactive power consumption for individual power receiving devices (groups of power receiving devices) of the consumer, determined in accordance with an agreement for the provision of services for the transmission of electrical energy, concluded by the supplier of last resort in the interests of this consumer.
Results for the control point of the TS 10/04 kV “Selyanovo B”
This substation is the first on the Lepetan high-voltage line. The installed power of the power transformer is 630 kVA. This transformer station mainly supplies electricity to private farmsteads, several administrative buildings, a school and a nursery. This station also provides lighting for public places. Information about the recorded voltages is presented in the following figure.
Figure 8. Change in voltage at the control point of the TS 10/04 kV “Selyanovo B”
One part of the changes in the THDU ratio is shown in Figure 9. The maximum THDU ratio was 7.53% and was recorded on June 6, 2005 at 20:07. This value was absolutely unacceptable.
Figure 9. Changes in the THDU coefficient at the control point of the TS 10/04 kV “Selyanovo B”
Figure 10. Changes in the 5th harmonic voltage at the control point of the TS 10/04 kV “Selyanovo B”
We can see the obvious similarity in Figures 9 and 10. At the same moment, the THDU and 5th harmonic voltage coefficients are at their maximum value. It is clear that the 5th voltage harmonic has a dominant influence on the shape of the THDU coefficient curve. The value of the 5th harmonic voltage (4.9%) exceeded the maximum permissible (according to government standards in Hungary and Australia). According to IEEE-519, this value is slightly below the maximum permissible.
Electricity certification schemes
Standard schemes are an important part of certification, as they determine the level of evidence of product compliance with current requirements. The rules established by Decree of the State Standard of the Russian Federation dated July 16, 1999 N 36 (as amended on August 21, 2002) provide for five electricity certification schemes:
| Scheme No. | Evidence of conformity, including testing | Certification of production in the presence of a quality management system (QMS) | IR coverage |
| 3 | Electricity testing at control points | — | Electricity testing at control points |
| 3a | Electricity testing at control points | Analysis of the energy supplier's production status | Testing electricity at control points and analyzing the state of production of the energy supplier |
| 5 | Electricity testing at control points | Certification of production or QMS of the energy supplier | Control of the certified QMS (production) |
| 10 | Declaration of conformity with accompanying documentation | — | Electricity testing at control points |
| 10a | Declaration of conformity with accompanying documentation | Analysis of the energy supplier's production status | Electricity testing at control points |
In addition to the totality of risks, the likelihood of an untruthful assessment of the product’s conformity and harm from its use, the choice of a certification scheme takes into account:
- level of potential danger;
- sensitivity of specified parameters to fluctuations in production and operational factors;
- sufficiency of the evidence base and comparability of certification costs to the actual purposes of conformity assessment.
Given the parameters of production and operational factors that are sensitive to fluctuations and characteristic of the transmission of electricity to consumers through distribution networks, the use of schemes 3, 3a and 5 is considered the most acceptable.
The choice of scheme is coordinated with the certification body, because it is the experts who determine the conditions for carrying out electricity certification activities, which ensure the sufficiency and reliability of evidence of the object’s compliance for the entire period of validity of the certificate.
Results for the control point of the TS 10/04 kV “Selyanovo SIZ”
This is the second transformer substation on the Lepetan high-voltage line. The installed power of the power transformer is 630 kVA. This transformer substation supplies electricity mainly to buildings, several private houses and lighting of public places. The recorded data is shown in the following figures.
Figure 11. Changes in the THDU coefficient at the control point of the TS 10/04 kV “Selyanovo SIZ”
Figure 12. Changes in the 5th harmonic voltage at the control point of the TS 10/04 kV “Selyanovo SIZ”
Again, we see an obvious similarity between the THDU coefficient and the shape of the 5th harmonic voltage waveform.
Results for the control point of the TS 10/04 kV “Plavda”
This transformer substation supplies electricity to several private farmsteads next to the water supply and sewerage organization in Tivat. The installed power of the power transformer is 1000 kVA. The recorded data is shown in the following figures.
Figure 13. Changes in voltage at the point of the vehicle “Plavda”
Figure 14. Changes in the THDU coefficient at the TS point “Plavda”
Figure 15. Changes in the 3rd harmonic voltage at the control point of the 10/04 kV “Plavda” vehicle
Figure 16. Changes in the 5th harmonic voltage at the control point of the 10/04 kV “Plavda” vehicle
In this case, the 3rd voltage harmonic has a dominant influence on the shape of the THDU coefficient curve (Figure 15). The highest value of the 3rd voltage harmonic occurs early in the morning (4.03%). The water and sewerage company has several small single-phase induction motors and two three-phase variable frequency induction motors.
Simulation model
The simulation model was developed in special software - SuperHarm®. Good agreement between the measurement results and the simulation results was achieved. The simulation was carried out for two operating conditions - low and high load. Also, the use of a passive filter was considered.
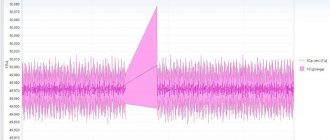
Figures 17 and 18 show the current harmonic spectrum before and after connecting the filter for the 7th harmonic. A sufficient reduction in current and voltage distortion has been achieved. The filter was placed at the measurement point at a voltage level of 10 kV. The highest values of the THDU and THDI coefficients are observed during the period of low daily load, so this mode is presented in the upper figures. The situation became better after installing the filter in high load mode. The improvement in voltage quality can be seen in Figures 19 and 20 and is also presented in Table 1. It is noteworthy that the 7th harmonic, THDU and THDI coefficient values decrease after installing the filter (bottom of Table 7).
Figure 17. Current harmonic spectrum before installing a filter at the measurement point
Figure 18. Current harmonic spectrum after installing a filter at the measurement point
Figure 19. Voltage harmonic spectrum before installing a filter at the measurement point
Figure 20. Harmonic voltage spectrum after installing a filter at the measurement point
Table 7. THDI and THDU coefficients at the measurement point before and after filter installation - low load mode
| TS 10/0.4kV Harmonic Current Phase A & C Low Load | ||||||
| Name | Freq | Fund | %THD | H3 | H5 | H7 |
| BUS0.4.A | 50 | 20.0003 | 10.5573 | 0.38219 | 0.77426 | 1.92686 |
| BUS0.4.C | 50 | 20.9483 | 7.26388 | 0.466255 | 1.02319 | 1.02525 |
| TS 10/0.4kV Harmonic Current Phase A & C Low Load Filter Applied | ||||||
| Name | Freq | Fund | %THD | H3 | H5 | H7 |
| BUS0.4.A | 50 | 19.7251 | 6.30617 | 0.398267 | 0.953288 | 0.692753 |
| BUS0.4.C | 50 | 21.2563 | 6.58458 | 0.485869 | 1.25978 | 0.368601 |
| Voltage Harmonic Content Phase A & C Low Power | ||||||
| Name | Freq | Fund | %THD | H3 | H5 | H7 |
| BUS0.4.A | 50 | 19713.6 | 2.9338 | 77.4364 | 195.141 | 538.906 |
| BUS0.4.C | 50 | 20067.3 | 2.85104 | 85.0342 | 276.725 | 493.481 |
| Voltage Harmonic Content Phase A & C Low Power | ||||||
| Name | Freq | Fund | %THD | H3 | H5 | H7 |
| BUS0.4.A | 50 | 19987.4 | 1.22174 | 34.492 | 83.1519 | 226.994 |
| BUS0.4.C | 50 | 20145.8 | 1.26372 | 37.8745 | 122.594 | 219.887 |
Instruments for measuring power quality
Fluke 430 Series II Analyzers are used to diagnose, assess power quality, predict and troubleshoot power network problems.
Figure 21. Fluke 434-II, 435-II, and 437-II Power Quality Analyzers
Thanks to patented technology, the Fluke 434, 435 and 437 Series II analyzers calculate imbalance and harmonic power to determine true energy losses, and Fluke's unique algorithm shows them in monetary terms. Models vary in functionality, application and tasks and are aimed at specialists of different levels of training :
- The Fluke 434-II is aimed at users with a basic knowledge of power quality assessment. The device determines the basic values of power quality parameters: voltage, current, frequency, power, dips, surges, harmonics, imbalance;
- The Fluke 435-II has similar features to the Fluke 434-II, but is aimed at more experienced power quality users. The model has the PowerWave function, which carries out high-speed data collection based on rms values, shows the half-cycle and waveform that characterize the dynamics of electrical systems and is displayed in high detail on the screen. This allows you to see which combination is causing potential problems;
- The Fluke 437-II is the ideal solution for military, aviation, industrial and other transportation professionals. The 437-II has all the features of the 435-II, including PowerWave, but also has the ability to measure up to 400 Hz.
Read more about the Fluke 430 Series II Power Quality Analyzers on a separate page.
The ideal instrument for analyzing motor performance is the Fluke 438-II portable analyzer. It makes it easy to detect, predict, prevent and correct power quality problems in three-phase and single-phase power distribution systems by providing technicians with the mechanical and electrical information they need to effectively evaluate motor performance.
Figure 22. Fluke 438-II Power Quality and Motor Analyzer. Read more here.
Inspection control
Throughout the entire validity period of the certificate of conformity, experts of the OS body that issued the document carry out inspection control.
The frequency, scope and regulations of inspections depend on the certification scheme and require the performance of certain types of work:
- collection and processing of information about the certification object;
- preparation and approval of the IC program;
- implementation of verification activities;
- Conducting random electrical compliance tests and documenting inspection results;
- decision-making.
The final decision made by the certification body contains reasoned conclusions about the conformity of the quality and stability of electricity indicators, along with a conclusion confirming the possibility of further validity of the previously issued certificate.
A decision to suspend or completely terminate a certificate may be made if:
- the quality of electricity does not meet controlled standards;
- the document regulating the quality and testing methods of electricity has been updated;
- revision of power grid diagrams and contracts with consumers in terms of quality indicators may cause their non-compliance with current standards.
A decision suspending the validity of a certificate is made if the identified deficiencies can be eliminated by timely implementation of corrective measures.
A decision revoking a certificate may be made for the following reasons:
- impossibility of timely elimination of deviations;
- failure to implement corrective actions or lack of results within the prescribed period;
- the applicant's refusal to conduct an IR.
Russian legislation provides for mandatory certification not only for electricity; it also covers cable products and electrical equipment, including high-voltage devices.