What is an oscilloscope used for?
An oscilloscope is used by electronics engineers and radio amateurs to measure:
- amplitude of the electrical signal - the relationship between voltage and time;
- analyze the phase shift;
- see the distortion of the electrical signal;
- Based on the results, calculate the current frequency.
Despite the fact that the oscilloscope demonstrates the characteristics of the analyzed signal, it is more often used to identify processes occurring in an electrical circuit. Thanks to the oscillogram, specialists receive the following information:
- periodic signal shape;
- the meaning of positive and negative polarity;
- range of signal changes over time;
- the duration of the positive and negative half-cycle.
Most of this data can be obtained using a voltmeter. However, then you will have to make measurements with a frequency of several seconds. At the same time, the percentage of calculation errors is high. Working with an oscilloscope significantly saves time in obtaining the necessary data.
Oscilloscope - 1. Application in practice.
If you use a multimeter in your practice, then you have spent some time studying its capabilities. Spend some time with an oscilloscope too. There are slightly more controls. The main thing is to understand “what’s what.” I’ll try to show you a few things, and you’ll understand the rest on your own. I will also try to explain the concepts of “main modes, characteristics and terms used” and how it looks on oscillograms.
Scan.
In most oscilloscopes, the image on the screen is scanned from left to right along the width of the screen. Measured in units of time (seconds). In other words, this is “the time when the screen is completely filled with signal.” Then the picture changes.
Classic example of a sweep (right). Pulses “lying on their side” are nothing more than sawtooth voltage pulses of the scan generator (popularly called “saw”).
But there is a “but”. Imagine a “porridge”, this is when a signal is applied to the input of an oscilloscope that quickly changes in time, and there is a sweep generator that works on its own. And the oscilloscope begins to display the signal from different points. There will be an image, but you won’t be able to understand what it is.
Trigger.
Controls the sweep generator and starts it from the same point. Therefore we have a stable image. In this case, one of the following conditions may be met:
— launching a sweep generator based on signal level
. When the signal at the input reaches a certain level, the sweep starts;
— trigger by amplitude rise time
at the leading edge of the pulse, or according to the time of change in the amplitude of the trailing edge;
— launch “on failure” in a pulse sequence. When the pulse duration (normal) is set. The sweep in this case will always start from the point where the pulse duration is less or more than the set one; on the screen you will see exactly this time period where the failure occurs.
— Pulse capture when amplitude decreases (etc.)
These are not all possible options for trigger operating modes; some oscilloscope models have more of them - it all depends on the purpose of the oscilloscope and the tasks being solved.
The oscilloscope has controls that allow you to not only view
, but also
consider the signal
. More on this below.
One of these controls includes “Amplification” of the signal (threshold value of the input signal). It could be a “twist” or a button - who has what. But it's a must. And together with the sweep controls, it is a powerful tool.
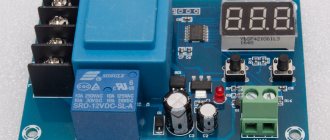
| Practical use We will use the oscilloscope in the photo on the right. Photo No. 1 The photo shows the device and its screen. Capacitive sensor connected. Subaru Forester car. Let's look at the ignition system. | |
| Photo No. 2 The device is turned on. Device menu, select the first item. The following items allow you to select the number of channels, and when you select them, you go to the next menu, which lists the main types of sensors and actuators of automotive systems that can be selected for any channel. But then all device settings are set automatically, based on a specific signal, a specific device. (This is the first difference between a car oscilloscope and an oscilloscope in general. It is “tailored” to specific types of signals). In addition, there are free samples: for signals from 0 - 5V...0 -12V |
Photo No. 3
The power is on, the sensor is connected, the motor is running. There is no signal. What is the reason?
Photo No. 4
No, there is a signal. See how photo No. 3 differs from No. 4. Look at the top, the item is highlighted, and below is its meaning. The 10ms sweep time remains unchanged. What changed?
The first photo shows which coil the connection was made to. Let’s imagine that there is no knowledge of “what a trigger is.” Is it possible to capture the image the same way as in the photo? If this is not done, it will constantly “run”.
Photo#5
And here the sweep has been changed: it was 10 - now 1ms. And the screen seems to be small.
Photo No. 6
* here I not only changed the scan, but also enlarged it (photo 2-point 3
). And there is already an opportunity to look at the area where the key worked and a little further. In principle, you can “roll” the signal until it ends.
Photo No. 7
Like this. The beginning is in photo No. 6, and the end is here:
Photo 8
You can also display cursors (if you need to look at the spark burning duration or saturation time).
Photo No. 9
Like that.
Cursor A is solid, cursor B is intermittent. Duration on screen - 4.60ms/
Photo No. 10
* cursors stand from the moment the key is turned on until the spark occurs.
Photo No. 11
* duration of spark burning.
Only 20 percent of the device’s capabilities are shown, only on one option and in one menu item (oscilloscope)
IMHO:
I don’t think that I work with a bad device and I think that it is unacceptable to work with bad devices. I use this device constantly for incoming diagnostics. It allows you to observe and carry out measurements with a sufficient degree of reliability of all
signals from the vehicle control system.
When it is necessary to carry out analysis, when the machine freezes, I do not use the oscilloscope and motor tester of this device.
Although
this
possibility is built into the device. It is inconvenient to “scroll” the signal, viewing the details, stretching it with sweep and amplification, without seeing the full phase or cycle. Especially when more than one channel is used. There is too much manipulation when performing transitions, which distracts from examining the signal. But that's all I can say about the shortcomings. I consider the statement about small screens, etc. to be unfounded and misleading.
But I always use graphic view
, selected items
from the current parameters
. This is when the device is turned on. in scanner mode and connected to the diagnostic connector. It is not always possible to compare the necessary parameters; they may appear on different “pages”. You need to “scroll through”, or highlight the ones you need, go into the mode of viewing only these parameters, and keep the numbers in your head. To put it simply: I selected up to 4 sensors (parameters), pressed a button and a graphic image appeared. The sweep is very slow, you can draw faster with your hand, and there are digital values next to each waveform. Same as in “date”. And everything is in one place - you look at the oscillogram and see the digital values.
To be continued
MARKIN Alexander Vasilievich
Belgorod
Tavrovo microdistrict 2, lane. Parkovy 29B (4722) 300-709
© 1999 – 2010 Legion-Avtodata
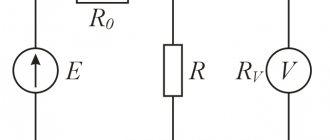
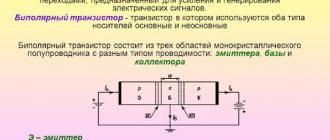
Operating principle of an oscilloscope
An oscilloscope takes measurements using a cathode ray tube. This is a lamp that focuses the analyzed current into a beam. It hits the device screen, deflecting in two perpendicular directions:
- vertical – shows the voltage being tested;
- horizontal – shows the time spent.
Two pairs of cathode ray tube plates are responsible for deflecting the beam. Those that are located vertically are always energized. This helps to distribute different polarity values. Positive attraction deviates to the right, negative attraction to the left. Thus, the line on the device screen moves from left to right at a constant speed.
The horizontal plates are also subject to electric current, which deflects the beam voltage display. Positive charge is up, negative charge is down. This is how a linear two-dimensional graph appears on the device’s display, which is called an oscillogram.
The distance that the beam travels from the left to the right edge of the screen is called scan. The horizontal line represents the measurement time. In addition to the standard two-dimensional linear graph, there are also circular and spiral scans. However, they are not as convenient to use as classic oscillograms.
terms of Use
Almost any electronic device is sensitive to certain operating conditions, and an oscilloscope is no exception. The basic requirements for the conditions of use of the device are as follows:
- Do not use the device in places of high humidity. Operation is affected not only by moisture, but also by air parameters;
- Do not connect the device to the network if there are flammable and combustible substances nearby;
- You should always keep the device clean and observe the operating temperature range, which ranges from −30 °C to 50 °C.
Important! To clean the device, use only soft and dry cloths or rags. Moisture getting under the housing is unacceptable, as this can cause serious problems in the operation of the equipment.
DC voltage shown as a straight line
Classification and types
There are two main types of oscilloscopes:
- analog - devices for measuring average signals;
- digital - devices convert the resulting measurement value into a “digital” format for further transmission of information.
Based on the operating principle, there is the following classification:
- Universal models.
- Special equipment.
The most popular are universal devices. These oscilloscopes are used to analyze various types of signals:
- harmonic;
- single pulses;
- pulse bursts.
Universal devices are designed for a variety of electrical devices. They make it possible to measure signals in the range of a few nanoseconds. The measurement error is 6-8%.
Universal oscilloscopes are divided into two main types:
- monoblock - have a general specialization of measurements;
- with replaceable blocks - adapt to a specific situation and type of device.
Special devices are developed for a specific type of electrical equipment. So there are oscilloscopes for radio signals, television broadcasting or digital technology.
Universal and special devices are divided into:
- high-speed – used in high-speed devices;
- memory - devices that store and reproduce previously recorded indicators.
When choosing a device, you should carefully study the classifications and types in order to purchase a device for a specific situation.
Measuring voltage
To reduce errors, since observation is visual, it is recommended that the graph occupy 80–90% of the monitor. When measuring voltage and frequency (there is a time interval), it is necessary to place the gain and sweep speed controls in the extreme right positions.
Procedure
Voltage is measured by vertical scaling. Algorithm:
- Before starting, connect the probe signal to its own ground wire (needle to “crocodile”) or set the input mode toggle switch to the “ground” position.
- The “pulse of a corpse” will be displayed, if not, then you need to move the offset, stabilization and level - perhaps the image was hidden and did not start.
- We use the selectors to adjust the shift of the strip to zero and use the “up-down” regulator to set the scan to the horizontal grid, so it will be possible to correctly calculate the height of the oscillogram. If the oscilloscope is old or analog, then you need to let it warm up for about 5 minutes.
- We set the voltage measurement limit, it is recommended to take it with a reserve, then you can reduce it.
- A signal is given to the input (or its switch is moved to one of the operating positions). A graph will appear on the monitor.
- Let's illustrate the process: the battery has 1.5 V, if you touch the ground branch of the probe to its minus, and the signal branch to the plus, then a graph jump of 1.5 Volts will appear.
To find the height of the graph, move the oscillogram with the selector so that the mark by which the amplitude is calculated is on the central vertical with fractions. We get the sensitivity of the deviation - 1 v/div, the size of the oscilloscope. - 2.6 div., and hence ampl. = 2.6 V.
Below is an illustration on an analog device: 3.4 div. — max. voltage. The next picture shows vertical scaling. The “smooth” regulator (the part with the green mark) is in the right limit position, the sensitivity toggle switch is 0.5 V/div. Scale multiplier — ×10. Voltage calculation:
Device and main technical parameters
Each device has a number of the following technical characteristics:
- The coefficient of possible error when measuring voltage (for most devices this value does not exceed 3%).
- The value of the device scan line - the larger this characteristic, the longer the observation time period.
- Synchronization characteristic, containing: frequency range, maximum levels and system instability.
- Parameters of the vertical deviation of the signal with the input capacitance of the equipment.
- Transient response values showing rise time and overshoot.
In addition to the basic values listed above, oscilloscopes have additional parameters in the form of an amplitude-frequency characteristic, demonstrating the dependence of the amplitude on the signal frequency.
Digital oscilloscopes also have a large amount of internal memory. This parameter controls the amount of information that the device can record.
Where is it used?
Areas of application:
- always in scientific, technical laboratories, research departments at factories that produce electrical appliances, for example, the manufacturer must know how his products react to interference;
- during in-depth analysis of assemblies, during adjustment and repair of electrical devices: from radio and cellular communications to machine motor circuits. The device is indispensable for radio amateurs.
The device provides visual information about the characteristics of complex signals, shows time and amplitude data of changes, which is important for calculations and determining how the studied object will behave over periods under specific conditions.
Story
Ondograph Hospital
The electrical oscillatory process was initially recorded manually on paper. The first attempts to automate recording were made by Jules François Joubert in 1880, who proposed a step-by-step semi-automatic signal recording method. The development of Joubert's method was the fully automatic Hospitalier ondograph. In 1885, Russian physicist Robert Colley created an oscillometer, and in 1893, French physicist André Blondel invented a magnetoelectric oscilloscope with a bifilar suspension.
The moving recording parts of the first oscilloscopes had high inertia and did not allow recording fleeting processes. This drawback was eliminated in 1897 by William Duddell, who created a light-ray oscilloscope using a small, lightweight mirror as a measuring element. The recording was made on a photosensitive plate. The pinnacle of development of this method was multichannel strip oscilloscopes in the mid-20th century.
Almost simultaneously with Duddell, Karl Ferdinand Braun used the kinescope he invented to display the signal. In 1899, the device was modified by Jonathan Zenneck, who added horizontal scanning, making it similar to modern oscilloscopes. In the 1930s, Brown's kinescope replaced Zvorykin's kinescope, which made devices based on it more reliable.
At the end of the 20th century, analog devices were replaced by digital ones. Advances in electronics and the advent of fast analog-to-digital converters made them the dominant oscilloscope by the 1980s.
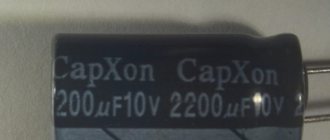
Divider (attenuator)
The signal under study can have a voltage from tenths to hundreds of volts. There are oscilloscopes with a built-in sensitivity control - attenuator. It looks like a graduated switch. It sets the “weight” of one division on the screen and determines how many times the input signal is reduced. If a low level is expected, we simply set it to 1 or 0.1. In this case, one vertical division on the screen will be 1 V and 0.1 V, respectively. And the signal will be “lowered” by 1 time (that is, it will be transmitted as is) or amplified by 10 times before being sent to the input (this is if it is set to 0.1).
Not all oscilloscopes have a built-in divider (attenuator). This device comes with external dividers of 1:10 or 1:100. These are rectangular or cylindrical nozzles with connectors on both sides. They are installed in the input connector and through them the voltage is supplied to the input, but already reduced by the appropriate number of times.
It is not necessary to set a divisor. The need is determined by the expected signal level. The specifications indicate the maximum input voltage that can be supplied to the device without a divider and with a divider. We set the nozzle according to the level of the expected signal.
If the level is unknown, set the largest divisor first (or the largest division on the attenuator). This will protect the device from burning out if the potential is high. Based on the results of the first measurement, the optimal mode is selected.
Dividers
How to choose
You need to imagine for what purposes and how often the device will be used, to study what signals it is intended for. Consider the number of points for simultaneous measurement, singleness or periodicity of oscillations. Sometimes Soviet-made devices are used. But getting precise tuning with them is difficult.
Number of channels
By the number of channels, oscilloscopes can be single-channel, simple (2-4 channels), advanced (up to 16 channels). Multiple channels allow you to simultaneously analyze incoming signals.
Power type
You can take the device with the battery with you when traveling. This is convenient for technicians who check equipment at its location. If you do not make field trips, it is better to take a network-powered oscilloscope, since it is more stable and reliable.
Sampling frequency
Sampling frequency is important for single-shot and transient measurements. The higher this parameter, the more accurate the signal image on the screen can be obtained.
Bandwidth
For simple studies of digital circuits and amplifiers, the optimal audio frequency is 25 MHz. For professional measurements, you need a device with this parameter - up to 200 or even up to 500 MHz. Modern communication lines operate at very high frequencies. The frequency of the signals under study should be 3-5 times less than the bandwidth.
FAQ
Fluke is one of the world's leading manufacturers of digital handheld oscilloscopes.
Question No. 1. When choosing an oscilloscope, what is the optimal bandwidth?
The instrument's bandwidth should be slightly greater than the maximum frequency of the signals to be measured. For example: with a maximum signal frequency of 80 MHz, it is recommended to select a model with a 100 MHz bandwidth.
Question No. 2. Is the cost of an oscilloscope a guarantee of its higher technical performance?
Not always. When choosing, you should first think about whether an expensive model is needed specifically for your measurements. After all, many technical functions and “bells and whistles” may simply “stand idle” due to uselessness.
Question No. 3. The device can no longer perform the assigned tasks due to their complication. What to do? Should I buy a new one?
Some series of oscilloscopes from well-known manufacturers allow you to increase the bandwidth in the future, that is, perform an upgrade. To do this, you do not need to take the device somewhere; you just need to buy a digital key and enter the code in the appropriate menu.
Question No. 4. Sometimes anomalies happen that are so short-lived that the oscilloscope cannot reproduce them on the screen. How to find them?
The digital backlight (phosphor) function does an excellent job of detecting super-short-term anomalies, displaying rarely occurring events on the screen in a different color. Thanks to this they are clearly visible on the screen.
Question No. 5. Can an inexpensive device that works well in a laboratory environment be used to solve more serious problems for more complex equipment?
Features of digital models
A digital oscilloscope works differently - the analog signal is converted into digital form. In this form, it is recorded in memory and transmitted to the monitor, where it is converted from digital format back into analog form. Display on the screen begins only at the moment when the input level exceeds a certain value (set by settings).
The frequency of changing the picture depends on the selected operating mode: automatic, single and normal. Normal is the equivalent of waiting.
Simplified block diagram of a digital oscilloscope
Why are digital models better? Firstly, this conversion makes the image more stable. Secondly, it's easier to zoom in and out. Thirdly, there is a recording option. Well, and the dimensions. The smallest analog oscilloscope, S1-94, has dimensions of 100*190*300 mm and a weight of 3.5 kg. And digital ones with dimensions of 100*50-60*13-20 mm have a weight of about 150-300 grams. And this includes batteries.
What is it for?
What is an oscilloscope for? This is simply a necessary thing when repairing electronic equipment, when independently assembling or improving any devices. For many people, a tester or multimeter is enough. Yes. But for repairing simple devices without microcircuits and microprocessors. With a multimeter you can check for open circuits, short circuits, and measure voltage and current. Neither the waveform nor the specific parameters of the sine wave or pulses can be measured or seen.
An oscilloscope is needed to measure voltage and visually display signals. The photo shows a Hantek DSO5102B digital two-channel oscilloscope in operating mode
But it happens that all the parts seem to be in good order, but the device does not work. And all because some parts are demanding not only on the physical parameters of the power supply (voltage, current), but also on the signal shape. Some semiconductor parts, almost all microcircuits and processors, suffer from this. And now only the most basic appliances such as a boiler can do without them. So it turns out that you can find a burnt resistor or a broken transistor with a multimeter. But for a slightly more complex breakdown it is no longer possible to eliminate it. It is for these cases that you need an oscilloscope. It allows you to see the waveform, determine if there are any deviations and find the source of the problem.
Story
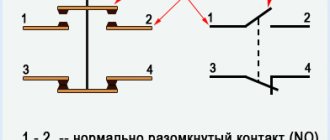
A functional trigger can be created from a conventional relay with an electromechanical drive. By properly setting the control circuit contacts, the power group is turned on after a certain combination of input signals. A separate key performs a reset.
RS trigger circuit on one relayElectronic analogues were assembled at the beginning of the last century from lamp devices. The current schemes were first published by Russian and English scientists in 1918-20. Later, semiconductor transistors began to be used. Nowadays, corresponding devices are created using microelectronic technologies.
Measurement technique
The oscilloscope measures electrical voltage and generates an amplitude graph of electrical fluctuations. Digital devices can remember the resulting schedule and return to it.
Oscillations are displayed on the screen in a two-dimensional coordinate system (voltage is the vertical axis, time is the horizontal axis), forming a graph - an oscillogram. There is a third component of research - signal intensity (or brightness).
If there are no input pulses on the screen, the horizontal line is “zero”, indicating the absence of voltage. As soon as voltage is applied to the input (or inputs) of the device, one or several graphs become visible on the screen simultaneously (depending on the number of measured signals).
The shape of a graph of electrical vibrations can be:
- sinusoid;
- damped sinusoid;
- rectangle;
- meander;
- triangles;
- sawtooth vibrations;
- pulse;
- difference;
- complex signal.
To obtain a stable graph of oscillations, the device contains a synchronization unit. It is possible to obtain a cyclic display of oscillations only after setting the synchronization value. It is taken as the “starting” one and serves as the starting point of the schedule. All jumps are displayed relative to this point.