Electrical equipment does not operate at full capacity all the time. This obvious fact can be understood using an everyday example. The lighting in the apartment is not turned on 24 hours a day. We use the iron only when we need to iron clothes. The kettle only works when you need to boil water. The situation is similar when it comes to electricity consumption in public and industrial buildings. Thus, the concept of installed and consumed (calculated) power is familiar to everyone since childhood. When designing the power supply of facilities, the non-simultaneous operation of equipment is taken into account using reduction factors. There are three reduction factors with different names, but their meaning is the same - demand factor, non-simultaneity factor, utilization factor. By multiplying the installed power of the equipment by one of these coefficients, the calculated power and the calculated current are obtained. Based on the design current, protective switching equipment (automatic circuit breakers, circuit breakers, RCDs, etc.) and cables or busbars are selected.
Pcalc = K×Pust, where Pust is the installed capacity of the equipment, Pcalc is the estimated power of the equipment, K is the demand/simultaneity/use coefficient.
When using this seemingly simple formula in practice, one is faced with a huge number of nuances. One of these nuances is the determination of the demand coefficient in panels that supply different types of loads (lighting, sockets, technological, ventilation and plumbing equipment).
The fact is that the demand coefficient depends on several parameters:
- Power;
- Load type;
- Type of building;
- Unit power of the electrical receiver.
Accordingly, when designing group and distribution networks, as well as electrical panel diagrams, this must be taken into account. Group networks (cables supplying end consumers) should be selected without taking into account the demand coefficient (the demand coefficient must be equal to one). Distribution networks (cables between switchboards) should be selected taking into account the demand factor. Thus, calculating the demand coefficient for switchboards with mixed loads brings additional difficulties and increases the complexity of the calculations.
Let's look at how the calculation of electrical loads is implemented in DDECAD using the example of a switchboard with a mixed load.
Initial data for calculation
As initial data, we assume that we need to calculate the loads for the office panel:
- The office has 6 rooms;
- Lighting using lamps with fluorescent lamps;
- The socket network for computers and “household” consumers is made separately;
- The office has air conditioning;
- The office has a dining room with a kettle, microwave, refrigerator and TV.
We distribute consumers into groups and fill out the calculation table.
Identification of the problem.
Demand coefficient Kc is the ratio of the calculated power Рр to the total rated power of the group.
| (displaystyle large {K_с = frac{P_р}{P_н}}) | (1) |
Regulatory documents provide tables of demand coefficients depending on the number of electrical receivers (ER) for various groups of equipment. With a known rated power Рн of the group and a known number of electrical elements, you can easily calculate the estimated power of the group using the formula
| (displaystyle large {P_р = K_с cdot P_н}) | (2) |
It would seem nothing complicated, but, as practice shows, even in such a simple case you can make a grave mistake.
In order not to be unfounded, I will give an example from life - a fragment from a project for the reconstruction of the central regional hospital.
The point is this. 3 switchboards are powered from the input distribution device (IDU) according to the main circuit. The composition of the EP is given in Table 1.
Table 1.
| Name of electronic signature | pH, kW | Quantity, pcs. |
| Shield 1 | 10,97 | 34 |
| monitor 1 | 2,0 | 2 |
| monitor 2 | 0,15 | 1 |
| quartz irradiator | 0,1 | 13 |
| electric towel | 1,1 | 1 |
| microwave | 0,6 | 1 |
| electric kettle | 1,2 | 1 |
| local lighting lamp | 0,1 | 2 |
| ventilation device | 0,1 | 1 |
| obstetric bed | 0,2 | 2 |
| infusion pump | 0,012 | 2 |
| table | 0,4 | 2 |
| aspirator | 0,1 | 2 |
| syringe pump | 0,05 | 2 |
| monitor 3 | 0,4 | 2 |
| Shield 2 | 19,8 | 17 |
| quartz irradiator | 0,1 | 6 |
| electric steam table | 1,0 | 1 |
| microwave | 0,6 | 1 |
| electric kettle | 1,2 | 1 |
| electric stove | 10,4 | 1 |
| electric boiler | 3,2 | 1 |
| anesthesia machine | 0,1 | 1 |
| local lighting lamp | 0,1 | 1 |
| table | 0,4 | 1 |
| sewing machine | 1,5 | 1 |
| negatoscope | 0,3 | 1 |
| computer | 0,4 | 1 |
| Shield 3 | 22,95 | 21 |
| mobile x-ray machines | 4,5 | 4 |
| quartz irradiators | 0,1 | 12 |
| electric towel | 1,1 | 1 |
| microwave | 0,6 | 1 |
| electric kettle | 1,2 | 1 |
| table | 0,4 | 1 |
| water heater | 0,45 | 1 |
| Total for shields | 53,72 | 72 |
To determine the design load, the designer used the “Methodological recommendations for determining the design electrical loads of healthcare institutions”, developed by the State Design and Research Institute for the Design of Healthcare Institutions “GIPRONIIZDAT” [1] , table 2.2.
For quantity of EP 72 pcs. the demand coefficient is 0.25.
| (displaystyle large {P_р = K_с cdot P_н = 0.25 cdot 53.72=13.43, kW}) | (3) |
| (displaystyle large {I_р = frac {P_р}{3 cdot U_ф cdot cos phi} = frac {13.43}{3 cdot 0.22 cdot 0.95} = 21.4 , A}) | (4) |
And now a final question.
What current is the thermal release of the circuit breaker installed in the ASU on this feeder selected for?
Answer: 63 A.
A legitimate question arises: “Why did the designer perform all the above calculations if, when choosing protective switching equipment, he was guided by another method known only to him?”
The formula for calculating the rated current of the thermal release (TR) of a circuit breaker is as follows:
| (displaystyle large {I_{t.r.} > 1.1 cdot I_r }) | (5) |
where (I_{t.r.}) – rated current of the thermal release;
(I_р) – calculated current of the electrical load.
Let's calculate the thermal release current using expression (5):
| (displaystyle large {I_{t.r.} > 1.1 cdot 21.4 = 23.5 , A}) | (6) |
In the line of rated currents, the next largest one comes with a rating of 25 A, followed by increasing 32 A (31.5 A for some types of releases), 40 A, 50 A, 63 A, etc.
Why wasn’t a TR with a rating of 25 A or 32 A chosen? And not even 40 A or 50 A, but 63 A?
Yes, because the designer perfectly understood that a thermal release with a rated current of 25 or 32 A would constantly operate (disconnect consumers) due to the actual load exceeding the calculated values, and chose a value of the TP rating at which its operation (disconnection) would not occur in operating (non-emergency) mode. It is obvious that the designer only figured out how to substitute the necessary numbers into the formulas in accordance with regulatory requirements, but did not understand the essence of the calculation. The point of the calculation is precisely to determine the design current of the electrical load, on the basis of which you can select the design of the supply line (cable/wire brand, cross-section and core material) and the technical characteristics of the protective switching equipment (rated current TP of the circuit breaker or rated current of the fuse link fuse).
Calculation of shield demand coefficient
The calculation of the demand coefficient for the shield will be carried out in two stages:
- Determination of demand coefficients for different types of consumers;
- Determination of the demand coefficient for the shield.
However, technically, this requires three steps in the DDECAD calculation table:
- Determination of demand coefficients for different types of consumers;
- Determination of the demand coefficient for the shield;
- Indication of demand coefficients for the shield and for groups.
2.1. Calculation of lighting network demand coefficient
Calculation of the demand coefficient for calculating the supply, distribution network and inputs into buildings for working lighting are carried out in accordance with the requirements of clause 6.13 of SP 31‑110‑2003 according to Table 6.5.
The demand coefficient for calculating the group network of working lighting, distribution and group networks of emergency lighting is taken equal to one in accordance with clause 6.14 of SP 31-110-2003.
Installed power of work lighting fixtures Rust osv. = 7.4 kW. We accept that the office in question belongs to buildings of type 3 according to Table 6.5 SP 31-110-2003. This capacity is not included in the table, therefore, in accordance with the note to the table, we determine the demand coefficient using interpolation. DDECAD users can easily and quickly determine the demand factor using the program's built-in calculation. We get Ks osv. = 0.976.
2.2. Calculation of the demand coefficient of the outlet network
The calculation of the demand coefficient of the outlet network is carried out in accordance with clause 6.16 of SP 31-110-2003 and Table 6.6. We get Ks roses. = 0.2.
2.3. Calculation of the demand coefficient of the computer power supply network
The demand coefficient for the computer power supply network is carried out in accordance with clause 6.19 of SP 31-110-2003 and Table 6.7. According to clause 9 of Table 6.7, for the number of computers more than 5, we obtain Ks com. = 0.4.
2.4. Calculation of the demand coefficient of the power supply network of multiplying equipment
The demand coefficient for the power supply network of the multiplying equipment is carried out in accordance with clause 6.19 of SP 31-110-2003 and Table 6.7. According to clause 12 of Table 6.7, for the number of copiers less than 3, we obtain Kc multiply. = 0.4.
2.5. Calculation of demand coefficient for technological equipment
The demand coefficient for the power supply network of kitchen equipment is carried out in accordance with clause 6.19 of SP 31-110-2003 and Table 6.7. Let us assume, in the general case, that kitchen equipment is technological equipment in the catering department of a public building. According to clause 1 of Table 6.7, the demand coefficient should be taken according to Table 6.8 and clause 6.21 of SP 31-110-2003. We get Ks kuh. = 0.8.
If the technological equipment for food preparation is not equipment in the catering unit of a public building, but is located in the eating area of a small office, then the demand coefficient should be taken as for an outlet network in accordance.
2.6. Calculation of demand factor for air conditioning equipment
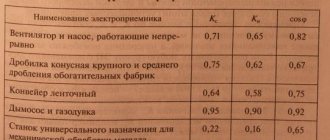
The demand coefficient for the power supply network of air conditioning equipment is carried out in accordance with clause 6.19 of SP 31-110-2003 and Table 6.7. According to item 5 of Table 6.7, the demand coefficient should be taken according to item 1 of Table 6.9 SP 31-110-2003. We get Kc cond. = 0.78.
2.7. Calculation of shield demand coefficient
The calculation of the shield demand coefficient will occur in two stages.
2.7.1. Determination of the demand coefficient for the shield
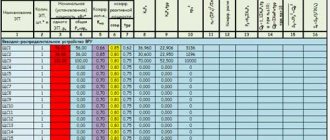
We enter the selected demand coefficients for each type of load in the “Coefficient” column. demand", column "D" in Excel. It turns out that we are setting demand coefficients for the group network. This is incorrect, but this is an intermediate step, we will correct this in the next step.
2.7.1. Indication of the demand coefficient for the shield and for groups
After entering the coefficients in the previous step in the bottom line, we get the calculated final coefficient of demand for the shield in the column “Coefficient. demand", column "D" in Excel.
The next step is to enter this value into the cell of the column “Kc per shield”, column “N” in Excel. After this, we return the group demand coefficients to their original value equal to one.
Installed capacity utilization factor
Capacity utilization factor
One of the most important indicators of the operational efficiency of any enterprise associated with the supply, distribution and generation of electricity is the installed capacity utilization factor. Its value is equal to the arithmetic mean power divided by the installed power measured in a certain period of time. The importance of this indicator is aimed at the overall efficiency of electrical substations. Here it is important not only their technological improvement and equipping with modern equipment, but also the qualifications of the personnel managing electrical installations.
When designing and calculating loads on the power supply network, entire design departments work and they already use not only the demand coefficient, but hundreds of other indicators that must correspond to the PUE. So you can’t do without this reference book and its recommendations regarding various aspects.
Coffee capsule Nescafe Dolce Gusto Cappuccino, 3 packs of 16 capsules
1305 ₽ More details
Coffee capsules Nescafe Dolce Gusto Cappuccino, 8 servings (16 capsules)
435 ₽ More details
Good smartphones
Result
As a result, we obtain a correctly calculated demand coefficient for the shield and the correct calculated powers and currents in the group network.
Next, DDECAD users continue to fill out the calculation table, which automatically calculates short-circuit currents, voltage losses (drops), and RCD leakage currents. After pressing one button, a single-line diagram of the shield is automatically obtained in AutoCAD.
Subscribe and receive notifications of new articles by e-mail
Problem Identification
Demand coefficient Kc is the ratio of the calculated power Рр to the total rated power of the group.
Kc=Pr/Rn (1)
Regulatory documents provide tables of demand coefficients depending on the number of electrical receivers (ER) for various groups of equipment. With a known rated power Рн of the group and a known number of electrical elements, you can easily calculate the estimated power of the group using the formula
Рр=Кс*Рн (2)
It would seem nothing complicated, but, as practice shows, even in such a simple case you can make a grave mistake.
In order not to be unfounded, I will give an example from life - a fragment from a project for the reconstruction of the central regional hospital.
The point is this. 3 switchboards are powered from the input distribution device (IDU) according to the main circuit. The composition of the EP is given in Table 1.
Table 1.
| Name of electronic signature | pH, kW | Quantity, pcs. |
| Shield 1 | 10,97 | 34 |
| - monitor 1 | 2,0 | 2 |
| - monitor 2 | 0,15 | 1 |
| — quartz irradiator | 0,1 | 13 |
| - electric towel | 1,1 | 1 |
| - microwave | 0,6 | 1 |
| — electric kettle | 1,2 | 1 |
| — local lighting lamp | 0,1 | 2 |
| - ventilation device | 0,1 | 1 |
| - bed for obstetrics | 0,2 | 2 |
| — infusion pump | 0,012 | 2 |
| - table | 0,4 | 2 |
| - aspirator | 0,1 | 2 |
| - syringe pump | 0,05 | 2 |
| - monitor 3 | 0,4 | 2 |
| Shield 2 | 19,8 | 17 |
| — quartz irradiator | 0,1 | 6 |
| — electric steam table | 1,0 | 1 |
| - microwave | 0,6 | 1 |
| — electric kettle | 1,2 | 1 |
| - electric stove | 10,4 | 1 |
| - electric boiler | 3,2 | 1 |
| - anesthesia machine | 0,1 | 1 |
| — local lighting lamp | 0,1 | 1 |
| - table | 0,4 | 1 |
| - sewing machine | 1,5 | 1 |
| - negatoscope | 0,3 | 1 |
| - computer | 0,4 | 1 |
| Shield 3 | 22,95 | 21 |
| — mobile x-ray machines | 4,5 | 4 |
| — quartz irradiators | 0,1 | 12 |
| - electric towel | 1,1 | 1 |
| - microwave | 0,6 | 1 |
| — electric kettle | 1,2 | 1 |
| - table | 0,4 | 1 |
| — water heater | 0,45 | 1 |
| Total for shields | 53,72 | 72 |
To determine the design load, the designer used the “Methodological recommendations for determining the design electrical loads of healthcare institutions”, developed by the State Design and Research Institute for the Design of Healthcare Institutions “GIPRONIIZDAT” [1] , table 2.2.
For quantity of EP 72 pcs. the demand coefficient is Kc=0.25.
Рр=0.25*53.72=13.43 kW (3)
Iр=Рр/(3* Uф)/ cosф=8.03/(3*0.22)/0.95=21.4 A (4)
And now a final question.
What current is the thermal release of the circuit breaker installed in the ASU on this feeder selected for?
Answer: 63 A.
A legitimate question arises: “Why did the designer perform all the above calculations if, when choosing protective switching equipment, he was guided by another method known only to him?”
The formula for calculating the rated current of the thermal release (TR) of a circuit breaker is as follows:
It.r. > 1.1* Iр (5),
where It.r. – rated current of the thermal release;
Iр – calculated current of the electrical load.
Let's calculate the TR current:
It.r. > 1.1*21.4=23.5 A (6)
In the line of rated currents, the next largest one comes with a rating of 25 A, followed by increasing 32 A (31.5 A for some types of releases), 40 A, 50 A, 63 A, etc.
Why wasn’t a TR with a rating of 25 A or 32 A chosen? And not even 40 A or 50 A, but 63 A?
Yes, because the designer perfectly understood that a thermal release with a rated current of 25 or 32 A would constantly operate (disconnect consumers) due to the actual load exceeding the calculated values, and chose a value of the TP rating at which its operation (disconnection) would not occur in operating (non-emergency) mode. It is obvious that the designer only figured out how to substitute the necessary numbers into the formulas in accordance with regulatory requirements, but did not understand the essence of the calculation. The point of the calculation is precisely to determine the design current of the electrical load, on the basis of which you can select the design of the supply line (cable/wire brand, cross-section and core material) and the technical characteristics of the protective switching equipment (rated current TP of the circuit breaker or rated current of the fuse link fuse).
Workshops for general industrial purposes
The very first section does not include construction equipment or any highly specialized workshops, since it is basic. Here we consider those workshops and buildings that are used everywhere, and not in specialized production. For example, here you can find out the demand coefficient for electrical equipment in the block of main workshops - it is equal to 0.4-0.5. This value, at first glance, may seem small, but in fact it is quite normal - as the table progresses, you will see much smaller values of this coefficient. For example, even in this same section there are low coefficients - for example, for the same block of auxiliary workshops it does not exceed 0.35. If we take the highest coefficient in this section, then it can be found in thermal load shops where heating furnaces operate. It is largely due to them that the indicator for this workshop is so high - 0.7-0.8. Now you have a first idea of what a section of the table looks like as a whole - regardless of whether it describes construction equipment, smelting shops, or anything else, the table will have a section in which the names of the shops will be placed. And opposite these names the approximate coefficient of demand for electrical appliances in this workshop will be demonstrated. Therefore, electricians now, when organizing electrical wiring and power supply in production, do not have to determine each time by scientific probing, trial and error, what exactly the demand will be for specific electrical appliances of a certain workshop - they have average values that they can safely rely on in their work.