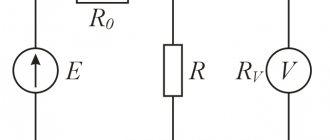
Digital representation of dynamic processes makes it difficult to perceive and complicates the calculation of output parameters after changes in input conditions or as a result of processing performed. A vector diagram of currents and voltages helps to successfully solve the indicated problems. Familiarization with theory and practical examples will help you master this technology.
Diagram explaining the short circuit process in a three-phase electricity meter circuit
Types of vector diagrams
Vector graphics are well suited for correctly displaying variables that determine the functionality of radio devices. This implies a corresponding change in the basic parameters of the signal along a standard sinusoidal (cosine) curve. To visualize the process, harmonic oscillation is represented as a projection of a vector onto the coordinate axis.
Using standard formulas, it is easy to calculate the length, which will be equal to the amplitude at a certain point in time. The tilt angle will indicate the phase. The total influences and corresponding changes in vectors obey the usual rules of geometry.
There are high-quality and accurate diagrams. The first ones are used to take into account mutual connections. They help make a preliminary assessment or are used to completely replace calculations. Others create taking into account the results obtained, which determine the size and direction of individual vectors.
Pie chart
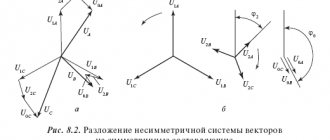
Let us assume that we need to study the change in current parameters in a circuit for different values of resistor resistance in the range from zero to infinity. In this circuit, the output voltage (U) will be equal to the sum of the values (UR and UL) on each of the elements. The inductive nature of the second quantity implies a perpendicular relative position, which is clearly visible in part of figure b). The triangles formed fit perfectly into the 180 degree circle segment. This curve corresponds to all possible points through which the end of the vector UR passes with a corresponding change in electrical resistance. The second diagram c) shows a current lag in phase by an angle of 90°.
Line chart
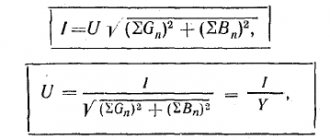
Shown here is a two-pole element with active and reactive conductivity components (G and jB, respectively). A classic oscillatory circuit created using a parallel circuit has similar parameters. The parameters noted above can be represented by vectors that are constantly located at an angle of 90°. A change in the reactive component is accompanied by a movement of the current vector (I1...I3). The formed line is located perpendicular to U and at a distance Ia from the zero point of the coordinate axis.
Preparing data for a ray diagram
As mentioned above, this template will have the ability to visually build connections for up to 20 participants (companies, branches, counterparties, etc.). The template worksheet "Data" provides a table for populating incoming values. For example, let’s fill it out for 14 market participants:
On the same sheet we will create an additional table, which is a matrix of connections of all possible participants, generated by the formula:
With the data preparation completed, we move on to processing.
How to calculate the sum of vectors?
Vectors and matrices in a spreadsheet are stored as arrays.
It is known that the sum of vectors is a vector whose coordinates are equal to the sums of the corresponding coordinates of the original vectors:
To calculate the sum of vectors you need to perform the following sequence of actions:
– Enter the values of the numerical elements of each vector into ranges of cells of the same size.
– Select a range of cells for the calculated result of the same dimension as the original vectors.
– Enter the formula for multiplying ranges into the selected range
– = Vector_Address_1 + Vector_Address_2 Address
– Press the key combination [Ctrl] + [Shift] + [Enter].
Example.
Two vectors are given:
It is required to calculate the sum of these vectors.
Solution:
– To cells in the range A2:A4
Let's enter the values of the coordinates of vector a1, and into the cells of the range
C2:C4
- the coordinates of vector a2.
– Select the cells of the range in which the resulting vector C will be calculated ( E2:E4
) and enter the formula into the selected range:
=A2:A4+C2:C4
– Press the key combination [Ctrl] + [Shift] + [Enter]. In cells in the range E2:E4
the corresponding coordinates of the resulting vector will be calculated.
Vector diagrams and complex representation
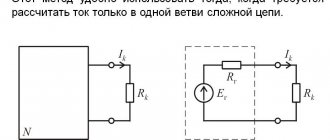
Loop current method
Such tools help to build visual graphic diagrams of oscillatory processes. A similar result is achieved by using complex numerical expressions. In this version, in addition to the axis with real values, an additional coordinate segment with imaginary values is used. To represent a vector, use the formula A * ei ( wt + f 0) , where:
- A – length;
- W – angular velocity;
- f0 – starting angle.
The value of the real part is A*cos*(w*t+f0). This expression describes a typical harmonic oscillation with basic characteristics.
Application examples
Resonance conditions
The following sections provide descriptions of the problems that can be solved using the presented methodology. It should be emphasized that the use of complex numbers is suitable for complex calculations with high accuracy. However, in practice, it is often quite common to use relatively simple vector graphics with a visual display of the original information in one picture.
Mechanics, harmonic oscillator
This term refers to a device that can be removed from an equilibrium state. After this, the system returns towards its original position, and the force (F) of the corresponding impact depends on the distance of the primary movement (d) in direct proportion. Its value can be clarified using a constant correction factor (k). The above definitions are related by the formula F=-d*k
Formulas for calculating the main parameters of a harmonic oscillator
For your information. Similar processes occur in systems of a different nature. An example is the creation of an analogue based on an electrical oscillatory circuit (series or parallel). The formulas remain the same with the corresponding parameters replaced.
Free harmonic oscillations without damping
Continuing the study of the topic using examples of mechanical processes, we can note the possibility of constructing a two-dimensional diagram. In this case, the speed is displayed on the X-axis in the same way as in the one-dimensional version. However, here we can additionally take into account the factor of acceleration, which is directed at an angle of 90° to the previous vector.
Harmonic oscillator with damping and external driving force
In this case, you can also use vector graphics to study the mutual influence of additional factors. As in the previous example, speed and other quantities are represented in two dimensions. To correctly model the process, the total influence of external forces is checked. It is directed to the center of the system (equilibrium point). Using geometric formulas, the amplitude of mechanical vibrations after the initial impact is calculated, taking into account the damping coefficient and other significant factors.
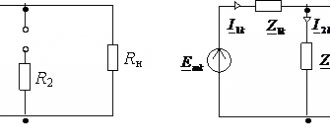
Calculation of electrical circuits
Vector graphics are used for relatively simple circuits that are created from a set of elements of the linear category: capacitors, resistors, inductors. For more complex circuits, the “Complex Amplitudes” calculation method is used, in which reactive components are determined using impedances.
Vector diagram for connection diagram without neutral wire - star
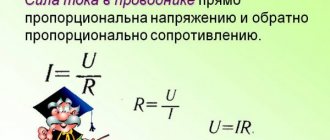
The vector diagram in this case serves as an auxiliary drawing that simplifies the solution of geometric problems. For coils and capacitors, in order not to use complex calculus, a special term is introduced - reactance. With a sinusoidal current, the change in voltage on the inductive element is described by the formula U=-L*w*I0sin(w*t+f0).
It is easy to see the similarity with the classical Ohm's law. However, in this example the phase changes. According to this parameter, the voltage on the capacitor lags behind the current by 90°. In inductance there is an inverse distribution. These features are taken into account when placing vectors in the figure. The formula takes into account the frequency, which affects the value of this element.
Circuits and vector diagrams for an ideal element and a lossy dielectric
Fourier transform
Vector technologies are used to analyze the spectra of radio signals in a certain range. Despite the simplicity of the technique, it is quite suitable for obtaining fairly accurate results.
Addition of two sinusoidal oscillations
When studying such signal sources, it is recommended to work with relatively small frequency differences. This will help create a graph at a user-friendly scale.
Fourier transform of a square wave
In this example, we operate with the sum of sinusoidal signals. Successive addition of vectors forms a polygon rotating around a single point. For correct calculations, the differences between continuous and discrete spectrum distributions should be taken into account.
Diffraction
For this case, use the same display of individual sinusoids in the form of vectors, as in the previous example. The total value also fits within the circle.
Construction of a vector diagram of voltages and currents
Series and parallel connection of batteries
To study the technology, we will select a single-phase source of sinusoidal voltage (U). The current changes according to the formula I=Im*cos w*t. The connected circuit contains components connected in series with the following meanings:
- resistor: Ur=Im*R*cos w*t;
- capacitor: Uc=Im*Rc*cos (w*t-π/2), Rc=1/w*C;
- coil: UL= Im*RL*cos(w*t+π/2), RL=w*L.
When passing through an alternating current circuit, there will be a corresponding phase shift on the reactive elements. To construct vectors correctly, amplitudes are calculated and changes in directions are taken into account. Below is the sequence for creating graphics manually.
Diagram of voltages and currents on individual elements
Next, using elementary rules of geometry, the mutual influence of the vectors is checked.
Solving a vector equation
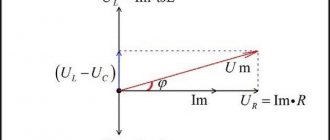
The first figure shows the result of adding two vectors under the condition that Uc is less than UL. By adding the value to the resistance, we get the resulting voltage Um. The third illustration shows the overall phase shift.
Vector display of processes in a parallel oscillatory circuit, voltage resonance
In a topographic diagram, the origin of coordinates is combined with the so-called “zero potential” point. This solution simplifies the study of individual sections of complex circuits.
Specialized online editor
On the Internet you can find a program for constructing vector diagrams online.
Addition and subtraction of vectors
The main advantage of vector ones is the ability to simply add and subtract two quantities. For example: you need to add two currents given by the equations
Let's add two given currents i1 and i2 according to the well-known rule of vector addition (Fig. 12.12, a). To do this, we depict the currents in the form of vectors from a common origin 0. We find the resulting vector as the diagonal of a parallelogram built on the terms of the vectors:
Im = Im1 + Im2
It is more convenient to add vectors, especially three or more, in this order: one vector remains in place, the others are transferred parallel to themselves so that the beginning of the next vector coincides with the end of the previous one.
Vector Im, drawn from the beginning of the first vector to the end of the last, is the sum of all vectors (Fig. 12.12, b).
Subtraction of one vector from another is performed by adding the forward vector (reduced) and the reverse (subtracted) (Fig. 12.13):
When adding sinusoidal quantities, in some cases an analytical solution can be applied: in relation to Fig. 12.12, a - according to the cosine theorem; to fig. 12.14, a - addition of vector modules; b - subtraction of vector modules, c - according to the Pythagorean theorem.