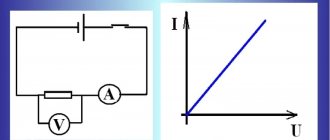
The processes occurring in an alternating current electrical circuit with active resistance and reactive inductance can be clearly expressed graphically.
The article will describe what vector diagrams are, where and what they are used for. The timing diagram and its purpose will also be described. At the end, an example of constructing a simple diagram for an electrical circuit with a series connection of elements will be given.
Definition
A vector diagram of currents and voltages is a geometric representation of all processes, quantities and amplitudes of a sinusoidal current. All available quantities are located on the plane in the form of vectors.
The construction of a vector diagram is used in physics and electrical engineering. By creating such a diagram, you can significantly simplify the calculations performed, as well as display the ongoing processes in a clear and accessible form.
The vector diagram method also allows you to see short and phase-to-phase short circuits that occur in an alternating current circuit, as well as calculate possible power losses.
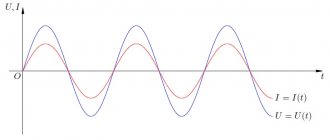
Usually such a diagram is built together with a time diagram. A timing diagram is a graphical representation of the input and output in an electrical circuit. Timing diagrams help determine the time interval between the start, flow and end of a signal. For example, when you press a button, a signal is generated that goes to the receiver and starts the process of its operation.
Timing diagrams are also applicable to a sinusoidal electrical circuit, since this current has an initial reference point (power on) and a time of movement from the current source to the consumer. Such diagrams are a graph that depicts the initial reference point, the time vector and phase angles.
Short circuit mode
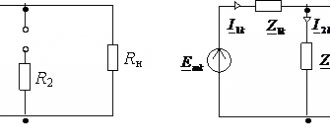
The short circuit mode is the mode when the secondary winding is short-circuited. The equivalent circuit of the transformer in this mode has the form shown in Fig. 11. For the short circuit mode, the following equations are valid:
The vector diagram (Fig. 12) in this mode is constructed similarly to the vector diagram for the idle mode. The angle is determined by the parameters of the secondary winding:. The peculiarity of this mode is that the EMF differs significantly from the voltage due to large short circuit currents. Considering that, the current can be neglected. Then the equivalent circuit can be simplified (Fig. 13). From the equivalent circuit we get: If we assume that , then the effective value of the emf will be equal to half the effective voltage value:
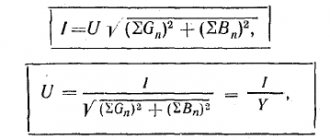
. Therefore, in short circuit mode, the magnetic circuit of the transformer is unsaturated. Effective value of short circuit current in accordance with Fig. 13, where is the complex impedance module of the transformer short circuit. When the short circuit current can exceed the rated value by 10-50 times. Therefore, under operating conditions, the short circuit mode is emergency
However, this mode is often carried out at reduced voltage to determine the parameters of the transformer. The voltage at which the short circuit current is equal to the rated one is called the short circuit voltage and is designated. It follows that the short circuit voltage represents the voltage drop across the internal resistance of the transformer at rated current and is therefore an important characteristic of the transformer
If we combine the real axis with the current vector, then the complex value can be represented as , where , are the active and reactive components of the short circuit voltage. Usually the module is expressed in relative units, or as a percentage. The value has a significant impact on the properties of the transformer in operating and emergency modes. Therefore, it is a passport value along with nominal data.
Varieties
Having figured out what a vector diagram is and what it is used for, you need to find out what types of construction exist. They differ in the nature of their construction and type. By nature they are:
- Accurate. A vector exact diagram is a display of the performed numerical calculation on the appropriate scale. Using it, phase parameters and amplitude values are determined in a strictly geometric way.
- High quality. Such histograms are constructed to observe the relationship between electrical quantities without using numerical characteristics. This method allows you to experiment with various parameters and simulate processes in electrical circuits.
A vector diagram of currents can be constructed in 2 different ways:
- Circular. Its principle is a vector that describes a change in characteristics by forming a circle or semicircle on a plane. With this option, the direction of movement is taken into account, taking into account the direction of the vector position.
- Linear. In such a vector diagram, when the characteristics change, the direction changes strictly rectilinearly.
Both constructions can be used to calculate the characteristics of alternating current in a circuit with resistance and inductance.
Construction
The construction of simple vector diagrams will be discussed in this section. For example, you can take a simple chain with several elements and their values. This scheme involves sequential connection of elements to each other. The circuit consists of an inductor, a capacitor and an active resistance. The parameters of each circuit element are given below.
- UL 15 volt inductor. The current in the inductive reactance has a phase shift of 90°.
- A UC capacitor with a voltage of 20 volts and a 90 degree lead.
- The voltage of the resistor UR is 10 volts, its direction coincides with the current I.
- The current in circuit I is 3 amperes.
Next, you can make a simple diagram that will help determine the voltage for the entire circuit.
- Place it on plane I in the form of a horizontal line with a scale of 1 A/cm (the scale can be any, the main thing is to carry out all the elements of the diagram of the same type on the same scale). The current itself is 3 amperes, so its length will be 3 cm.
- Now we need to plot the vertical vector UL on a scale of 5 V/cm. It displays the voltage of the inductor and is equal to 15 volts. Its length on the plane will also be 3 cm on this scale.
- Next, you need to graphically designate the voltage vector of the active resistance. Its reference point is located at the end of the vertical vector UL. For the accepted scale of 5 V/cm, it corresponds to a vector 2 cm long. The line must be strictly parallel to the horizontal vector I.
- Now we need to display the voltage of the capacitor UC on this diagram. Its beginning will be the end point of the vector UR, and the end of this vector will be located below the horizontal vector I. On a scale of 5 V/cm, it corresponds to a vector with a length of 4 cm.
- To determine the voltage U corresponding to such a communication circuit, you will need to do the following. The beginning of the vector is located at the accepted reference point, and its end will be located at the end point of the vector UC.
Therefore, if there is a circuit with a series connection of elements, then you can always quite simply construct a vector diagram and calculate the total voltage for such a circuit.
Method 2
Construction of vector diagrams taking into account all known values for an alternating current circuit with a series connection of a capacitor, resistor and inductor. With this construction, we also know the voltage of the circuit itself. The circuit consists of:
- Resistor UR;
- Capacitor UC;
- UL coils.
Next you need:
- The vector UR (resistor) is plotted on the Im plane. Its direction is exactly the same as the current, so it will be a horizontal line.
- The vector UC (capacitor) is laid down from the reference point. The vector is laid down at an angle of 90 degrees, since it has the previously specified 90° lead.
- The vector UL (inductor) is plotted from the same reference point. Its value is plotted exactly 90 degrees vertically, since there is a phase shift of 90 degrees.
This diagram can be used to control and calculate the influence of all known parameters of the circuit and elements, as well as their relationship with each other.
- Show the result of adding the vector UL and UC.
- As the resistance value increases, the difference between voltage and resistance can be determined using the new vector Um.
- In addition, you can determine the phase shift angle φ in the circuit.
The main advantage of a vector diagram is the following: simple and quick addition and subtraction of two parameters during the calculation of electrical circuits.
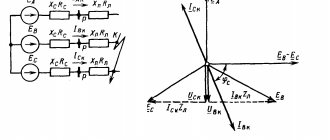
The concept of vectors and vector diagrams also implies the calculation of the power circuit of a three-phase network connected using the star method. It is constructed taking into account 3 deferred vectors from the 0 ordinate axis at once. This construction determines the vector from the current source to the receiver. A vector is constructed with the following values:
- The real values of quantities are plotted on the OX axis, and imaginary values are plotted on the OY axis.
- The angular magnitude is denoted as W.
- The vector Im itself and the phase shift angle φ are also present.
Next you need to do:
- Select a reference point on the plane.
- Delay the vector Im from it, taking into account the phase shift angle of 90°.
- The length of the vector Im is equal to the value of its voltage and is plotted on the selected scale.
In the same way, two more straight lines are superimposed on the plane. The general diagram will show the symmetry of the phases or their shift when a short circuit occurs. Such a diagram can serve as an example for calculating voltage, current or load on each phase with modeling of various parameters.
Vector diagrams and complex representation
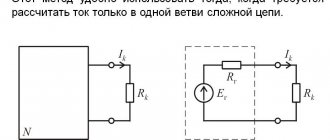
Loop current method
Such tools help to build visual graphic diagrams of oscillatory processes. A similar result is achieved by using complex numerical expressions. In this version, in addition to the axis with real values, an additional coordinate segment with imaginary values is used. To represent a vector, use the formula A * ei ( wt + f 0) , where:
- A – length;
- W – angular velocity;
- f0 – starting angle.
The value of the real part is A*cos*(w*t+f0). This expression describes a typical harmonic oscillation with basic characteristics.