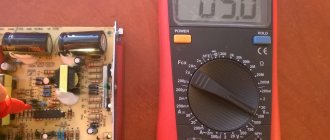
What is an oscilloscope
An oscilloscope is a device for visually displaying and measuring the parameters of signals of various shapes (the process is called “oscillography”). Signals are sent to the input and displayed on the screen. The screen is divided into squares, with two coordinate axes running through the center. Time is measured horizontally. Vertical - amplitude and/or voltage. The division value is set using the calibration knobs. The display mode is adjusted to each signal. Select the mode that is most convenient in this case (within the capabilities of the device).
An oscilloscope is not necessarily a big, bulky thing. There are portable digital models, there are set-top boxes. There are even programs that can be installed on a desktop computer or laptop with an adapter.
This is what a Tektronix DPO 3054 digital oscilloscope looks like. The signal is displayed on the display, the parameters are selected using the controls
Based on the number of simultaneously monitored signals, oscilloscopes are single-beam (single-channel/mono-channel) and multi-beam (multi-channel). Single-beam can receive only one signal at a time, multi-beam - two, three, four or more - up to 16. Depends on the device.
Which type is better? Multibeam. You can simultaneously monitor a signal at several points in the circuit. By changing the parameters, you will see the device’s response not only at the output, but also at different points in the circuit.
Which oscilloscope to choose for car diagnostics
Let's consider the most convenient and informative devices.
USB Autoscope Postolovsky
In first place in the ranking of practitioners is the Postolovsky USB Autoscope IV oscilloscope. Has extensive diagnostic functions.
Advantages
- Professional scripts from Andrey Shulgin.
- User-friendly interface.
- Wide measurement range from 6 to 300 volts.
- Processing scripts automatically.
- Informative efficiency script for CSS cylinders, showing the operation of injectors and ignition systems.
- Test battery, generator, starter. Shows faults automatically. Easy process of reading characteristics: it is enough to have access to the positive or negative terminals of the battery.
- Cylinder pressure test. Shows the marks of the gas distribution system, whether the phases are correct. Detects a spun drive disk.
Complete documentation for operating the device. Scripts and connection diagrams are described in detail. There are video instructions on the manufacturer's website. Responsive support.
Motodoc 3
Second in the list of oscilloscope ratings for diagnosing a car of any brand is Motodok 3. It has similar characteristics.
Advantages and disadvantages
- Script by Andrey Shulgin for cylinder efficiency. There are some disadvantages to synchronization with some cars that have a weak signal from the crankshaft sensor. But this is offset by convenience and fast operation.
- Connections over any distance via RJ 45 cable.
- The quality of the picture during diagnostics, which is not unimportant when working.
- Detailed documentation on the manufacturer's website.
As an example, only two oscilloscopes for car diagnostics are shown. There are other devices: they differ in price and manufacturer, but the measurement principle is the same. The most important thing is to have experience in reading waveforms for each make of car.
What is it for?
What is an oscilloscope for? This is simply a necessary thing when repairing electronic equipment, when independently assembling or improving any devices. For many people, a tester or multimeter is enough. Yes. But for repairing simple devices without microcircuits and microprocessors. With a multimeter you can check for open circuits, short circuits, and measure voltage and current. Neither the waveform nor the specific parameters of the sine wave or pulses can be measured or seen.
An oscilloscope is needed to measure voltage and visually display signals. The photo shows a Hantek DSO5102B digital two-channel oscilloscope in operating mode
But it happens that all the parts seem to be in good order, but the device does not work. And all because some parts are demanding not only on the physical parameters of the power supply (voltage, current), but also on the signal shape. Some semiconductor parts, almost all microcircuits and processors, suffer from this. And now only the most basic appliances such as a boiler can do without them. So it turns out that you can find a burnt resistor or a broken transistor with a multimeter. But for a slightly more complex breakdown it is no longer possible to eliminate it. It is for these cases that you need an oscilloscope. It allows you to see the waveform, determine if there are any deviations and find the source of the problem.
CSS script by Andrey Shulgin
So we got to the very essence of diagnosing car engines. For diagnosticians of any brand, this is the most informative script. It shows the performance of injectors, spark and compression in one test. To carry out this test, it is enough to remove the signal from the crankshaft position sensor and the timing from the spark of the first cylinder. The difficulty may lie in connecting to the DPKV of some brands, but this is smoothed out by the information that the script provides.
The procedure for recording a signal in relation to the USB Autoscope oscilloscope:
- Connect in parallel with the signal probe of the oscilloscope to the DPKV output
- If a DIS ignition system is installed, place the timing probe on the first cylinder, individual coil - use an inductive sensor.
- Start the engine and let it idle.
- Activate CSS script
- After 5-10 seconds, smoothly raise the speed to 3000 and lower it.
- After 5-10 seconds, sharply increase the speed and turn off the spark while leaving the gas pedal fully depressed.
- Stop the script.
Analysis of Andrey Shulgin's test
- Click the “Run script” button
- Set the input information for analysis: the number and order of operation of the cylinders, the ignition timing with an error of ±10°.
- Let's analyze the resulting image.
CSS script graph
- Idling - reduced efficiency of cylinder 3.8.
- Low compression in cylinder 3.
Thus, in 5 minutes you can find the cause of the “triggering” engine without unscrewing the spark plugs or measuring the compression.
The procedure for conducting an efficiency test on the Motodok 3 oscilloscope
The procedure for removing the script is similar to USB Autoscope:
Types of oscilloscopes
Based on the principle of signal conversion, oscilloscopes are either analog or digital. There is also a mixed type - analog-digital. The fundamental difference between them is in the methods of signal processing and the ability to memorize. Analog models broadcast a “live” signal in real time. There is no way to record it on such a device.
Analog-to-digital and digital already have recording capabilities. On them you can “unscrew” time back and view information, see the dynamics of changes in amplitude or time.
Another difference between digital oscilloscopes and analog ones is their size. Digital devices have significantly smaller dimensions
Digital oscilloscopes first digitize a sine wave, write this information to a storage device (memory), and then transmit it to the monitor screen. But not all digital models have long-term memory - in this case, recording is carried out cyclically. This is when a newly arrived signal is recorded over the previous one. The memory stores what appeared on the screen, but the period of time is not that long. If you need a recording that is five to ten minutes long, you need a storage oscilloscope.
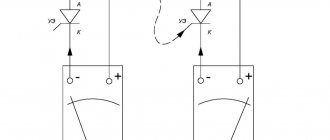
Transistors (field-effect and bipolar)
We switch the multimeter to the “testing” mode, connect the red probe to the base of the transistor, and touch the collector terminal with the black one. The display should show the breakdown voltage value.
A similar level will be shown when checking the circuit between the base and emitter. To do this, connect the red probe to the base, and apply the black probe to the emitter.
The next step is to check the same transistor terminals in reverse connection. We connect the black probe to the base, and with the red probe we touch the emitter and collector in turn. If the display shows one (infinite resistance), then the transistor is working. This is how field-effect transistors are tested.
Bipolar transistors are checked using a similar method, only the red and black probes are swapped. Accordingly, the values on the multimeter will also show the opposite.
What does an oscilloscope measure?
The oscilloscope screen displays a two-dimensional picture of the signal that is applied to the measuring input. There are two coordinate axes on the screen. The horizontal is the time axis, the vertical is the voltage. These parameters are measured. And from them the rest is calculated.
The oscilloscope screen displays the signals that are supplied to its inputs. This is, for example, a two-beam analog oscilloscope that shows the waveform at the input (sine wave) and output (square wave) of a pulse voltage converter
Here's what you can measure and monitor with an oscilloscope:
- Voltage (amplitude).
- Time parameters from which the frequency can be calculated.
- Monitor phase shift.
- See the distortions introduced by an element or section of the circuit.
- Determine the constant and temporary components of the signal.
- See if there is noise.
- Calculate the signal-to-noise ratio.
- See/determine pulse parameters.
The signal that the oscilloscope shows is quite informative. The distortions introduced by one or another part are visible; you can track how the shape/amplitude/frequency changes at each point of the circuit, after each part.
In addition to observing the waveform, an oscilloscope can be used to determine the integrity of resistances, capacitors, and inductors (see video below).
Using a special tester
For more complex checks, you need to use a special microcircuit tester, which you can purchase or make yourself. When dialing individual components of the microcircuit, data will be displayed on the display screen, analyzing which you can come to a conclusion about the serviceability or malfunction of the element.
It is worth remembering that in order to fully test the microcircuit, you need to completely simulate its normal operating mode, that is, ensure the supply of voltage at the required level. To do this, the test should be carried out on a special test board.
Often, it turns out to be impossible to test a microcircuit without soldering the elements, and each of them must be called separately. How to ring individual elements of the microcircuit after desoldering will be discussed below.
Design and principle of operation
Let's look at the block diagram and algorithm of operation of an analog oscilloscope. As already mentioned, you can change images horizontally and vertically. Devices based on a cathode ray tube (CRT) have two pairs of plates for this purpose. One pair for changing the vertical scale (amplitude or voltage). The second is for horizontal stretching or compression (time parameters).
Analog oscilloscope device: block diagram
The monitored signal is fed to an input amplifier, where it is amplified or reduced to specified values. The value is set by switches. The gain is usually from 100 to 1000. The amplified signal goes to the vertical scanning plates of the cathode ray tube.
The horizontal scan is formed on the basis of a sawtooth signal, which is generated in the corresponding block (scan generator). Its parameters are also set by the corresponding switch. The display on the CRT screen is in real time, with some delay. The delay value is specified in the technical characteristics of the device.
Basic blocks of an analog oscilloscope
The synchronization block is important for the operation of the oscilloscope. It ensures that the picture appears at the moment the potential arrives at the input. Due to this, we see the signal on the screen for a certain period of time. There are different types of synchronization. They are selected by a switch. Most often, synchronization from the signal being studied is chosen. There are also from the network and an external source.
Oscilloscope operating modes
An oscilloscope examines various types of signals. They can be constant (mains voltage), periodic (noise, interference, sounds, etc.). Periodic ones can occur randomly or at regular intervals. Depending on how often or rarely the signal occurs, one or another operating mode is selected. Most often, an oscilloscope has two modes: automatic (self-oscillating) and standby. It could also be one-time.
Selecting the oscilloscope operating mode
If we do not know how often the impulses occur, we usually choose the automatic mode. In it, even if there is no potential at the input or if its level is insufficient, the screen lights up. The “zero” signal is displayed - a straight line that should go along the horizontal axis on the screen (set along the line using the arrow controls). When potential appears at the input, it is displayed on the screen. The picture is periodically updated and we see the signal unfolding over time.
This is what the oscilloscope screen looks like in self-oscillating (auto mode) when there is no signal
Standby mode is good for signals that rarely appear. While there is nothing at the input, the screen does not light up. When any changes occur, it lights up, the sweep generator starts and the signal is displayed on the screen. Triggering can be configured either on the rising edge of the pulse/sine wave or on the descending edge. You can configure the trigger not for the signal being studied, but for the event that precedes it (if there is one).
Single mode configures the oscilloscope to accept a single signal. When the potential of the required level arrives at the input, the signal is displayed on the screen. After this, the device goes into an inactive state. And, even if there is the next potential at the input (or five, or one hundred and five), it will not register it. To receive another pulse, you need to “cock” the device again.
Divider (attenuator)
The signal under study can have a voltage from tenths to hundreds of volts. There are oscilloscopes with a built-in sensitivity control - attenuator. It looks like a graduated switch. It sets the “weight” of one division on the screen and determines how many times the input signal is reduced. If a low level is expected, we simply set it to 1 or 0.1. In this case, one vertical division on the screen will be 1 V and 0.1 V, respectively. And the signal will be “lowered” by 1 time (that is, it will be transmitted as is) or amplified by 10 times before being sent to the input (this is if it is set to 0.1).
Not all oscilloscopes have a built-in divider (attenuator). This device comes with external dividers of 1:10 or 1:100. These are rectangular or cylindrical nozzles with connectors on both sides. They are installed in the input connector and through them the voltage is supplied to the input, but already reduced by the appropriate number of times.
This is what the divider looks like. It is installed in the input socket, and the measuring cord is already connected to it
It is not necessary to set a divisor. The need is determined by the expected signal level. The specifications indicate the maximum input voltage that can be supplied to the device without a divider and with a divider. We set the nozzle according to the level of the expected signal.
If the level is unknown, set the largest divisor first (or the largest division on the attenuator). This will protect the device from burning out if the potential is high. Based on the results of the first measurement, the optimal mode is selected.
Features of digital models
A digital oscilloscope works differently - the analog signal is converted into digital form. In this form, it is recorded in memory and transmitted to the monitor, where it is converted from digital format back into analog form. Display on the screen begins only at the moment when the input level exceeds a certain value (set by settings).
The frequency of changing the picture depends on the selected operating mode: automatic, single and normal. Normal is the equivalent of waiting.
Simplified block diagram of a digital oscilloscope
Why are digital models better? Firstly, this conversion makes the image more stable. Secondly, it's easier to zoom in and out. Thirdly, there is a recording option. Well, and the dimensions. The smallest analog oscilloscope, S1-94, has dimensions of 100*190*300 mm and a weight of 3.5 kg. And digital ones with dimensions of 100*50-60*13-20 mm have a weight of about 150-300 grams. And this includes batteries.
Inductance and thyristors
Checking the coil for a break is carried out by measuring its resistance with a multimeter. The element is considered serviceable if the resistance is less than infinity. It should be noted that not all multimeters are capable of testing inductance.
The thyristor is checked as follows. We apply the red probe to the anode, and the black one to the cathode. The multimeter window should display infinite resistance.
After this, we connect the control electrode to the anode, observing the drop in resistance on the multimeter display to hundreds of ohms. We disconnect the control electrode from the anode - the resistance of the thyristor should not change. This is how a fully functional thyristor behaves.
How to use an oscilloscope
Initially, the operating mode of the oscilloscope is set (self-oscillating, standby or single). Then the attenuator mode is selected or the appropriate voltage divider is installed. This applies to analog devices. Digital at the input analyzes the signal and lowers/increases it to the required level. They have an analytical unit at the input, which itself lowers or increases the input signal to the required level.
Connecting an oscilloscope
The oscilloscope comes with a test cord or cords. Their number depends on the number of input channels of a particular model. If there is one channel, then there is one cord. Maybe two, three and up to sixteen. You need to connect as much as you intend to use.
Oscilloscope cords are difficult to confuse with others. One end has a probe and a branch. This is the "measuring" side. On the other there is a characteristic round connector. This part is connected to the measuring input.
The wire that goes away from the probe is for connecting to ground. It is often equipped with a clothespin or crocodile clip. It is necessary to connect it, the voltage may be different and grounding is necessary.
Oscilloscope Test Cords
Some oscilloscope cords have a switch on the handle that acts as a small amplifier (pictured at right).
After connecting the measuring cords, turn on the device to the network. Then, before work, we move the toggle switch/button to turn on the device to the working position. We can assume that the oscilloscope is ready for use.
Checking the oscilloscope before use
Before starting work, you need to check the oscilloscope. We plug it into the network and install the measuring cord. We touch the probe with our finger, a sinusoid with a frequency of 50 Hz appears on the screen - interference from the household electrical network.
If you touch the test probe with your finger, a sinusoidal signal will appear on the screen. The sine wave is not ideal, but if it exists and its frequency is 50 Hz, this means that the oscilloscope is working
Then we take the earth probe and touch it to the measuring probe (we continue to keep our finger on the tip of the probe). The signal disappears (a straight line is displayed). This means that the device is working properly.
How to measure voltage with an oscilloscope: alternating, meander, direct
As already mentioned, the voltage on the oscilloscope screen is displayed vertically. The entire screen is divided into squares. The vertical division value is set by a switch labeled “V/div”. Which is what Volts means by one division. Before sending a signal, set the beam exactly along the horizontal axis - this is important.
We give a signal and count how many cells the signal rises or falls from the zero level. Then we multiply the number of cells by the “division price” taken from the regulator. As a result, we obtain the signal voltage. In the case of a sinusoid or meander (positive and negative rectangular pulses), the voltage of the half-wave is considered - upper or lower.
Measuring voltage with an oscilloscope
To make it clearer, let's look at an example. In the photo there is a signal, the half-wave of which is understood and lowered by three cells. The division price on the regulator is 5 V. We have: 3 divisions * 5 V/division = 15 V. It turns out that this signal has a voltage of 15 volts.
If you need to measure DC voltage, again set the beam horizontally. Apply voltage and see how many cells the beam “jumped” or fell. Then everything is exactly the same: multiply by the division price and get the constant voltage value.
How to determine frequency with an oscilloscope
Frequency is defined as 1/T, where T is the period of the signal. And the period is the time during which the signal goes through a full cycle. For a signal on the screen, this is 5.7 cells. We count from the intersection with the horizontal axis to the second similar point.
How to determine the frequency of a signal using an oscilloscope
Next, we determine the division frequency using the sweep switch. The switch position is set to 50 milliseconds. Take the number of divisions and multiply by the number of cells. We get 50 ms * 5.7 = 285 ms. Convert to seconds. To do this, divide by 1000. We get 0.285 seconds. We count the frequency: 1/0.285 = 3.5 Hz
Capacitors, resistors and diodes
The serviceability of the capacitor is checked by connecting the probes of a multimeter to its terminals. Within a second, the resistance will increase from a few ohms to infinity. If you swap the probes, the effect will repeat.
To ensure that the resistor is working properly, it is enough to measure its resistance. If it is different from zero and less than infinity, then the resistor is working.
Checking diodes from a microcircuit is quite simple. By measuring the resistance between the anode and cathode in direct and reverse sequence (switching the multimeter probes), we make sure that in one case one is at the level of several tens to hundreds of Ohms, and in the other it tends to infinity (one in the “dialing” mode on the display ).
Oscilloscope bandwidth: what it is and what it affects
When choosing an oscilloscope, look at the following parameters:
- Bandwidth.
- Maximum input voltage.
- Sweep modes.
- Synchronization sources.
All parameters except bandwidth have already been discussed. Bandwidth is almost the most important indicator. It determines the maximum signal frequency that will be displayed without distortion. For example, with a bandwidth of 20 Hz - 20 MHz, anything with a higher frequency will be suppressed.
Where bandwidth ends, frequencies are severely suppressed
How to choose the transmission frequency? Depends on what signals you are going to study and how “deep” you need to study them. For analog signals everything is simple - the upper limit must be greater than the maximum frequency. With meanders everything is more complicated. In fact, they consist of the sum of the odd harmonics of the signal. The more harmonics, the more the shape looks like a square rather than something smoothed out. But high order harmonics have a very high frequency. If you need to study the fronts and their deflection, then the upper limit of the bandwidth is tens of gigahertz. And such devices are very expensive. For a regular sine wave, 10-20 MHz is enough, which is much cheaper.
Schematic diagram of the device
Initially, the device was assembled with homemade probes - tweezers with wide jaws, inconvenient when measuring on boards, with tight installation. Then I looked at express probes on Ali - tweezers for measuring SMD, connected to a multimeter. Having ordered tweezers, the wire was mercilessly shortened so that the accuracy would not be greatly affected during the measurement due to the length of the probe wires. Don't forget, the count is in milliOhms.
At first, my device was connected with probes to a multimeter and was made in the form of an attachment, but gradually I got tired of turning the multimeter knob every time, thereby exhausting the switching life. It was then that a friend of mine gave me a multimeter, due to the fact that I temporarily burned mine on an undischarged electrolytic capacitor. Subsequently, the device was restored, the resistors were re-soldered, and this multimeter, its connectors for connecting the probes on the board were broken off, and jumpers were thrown by someone, but the accuracy of the measurements was no longer the same.
ESR meter open case
But for my purposes, an error of 1-2 percent did not solve anything, and I decided to make the device completely autonomous. To do this, I fastened the case of the multimeter and the case of the ESR meter with screws, and for greater convenience, switched the simultaneous switching of the built-in multimeter and the ESR meter using a switch into two groups of contacts. Connections between the multimeter and the ESR meter, previously made using probes, were made by wires inside connected housings.
Capacitor tester - appearance
As practice has shown, the time required to bring the device into combat readiness, and then, after taking measurements, to turn it off, began to take significantly less time, and the ease of use has accordingly increased. Among the further improvements planned for this device is to switch it to battery power, from a Li-ion battery from a phone, with the ability to recharge from a charge adapter board via a built-in Mini USB socket, from any charger from a smartphone with the ability to connect a USB cable.
As practice has shown, I had previously converted the T4 transistor tester to battery power using a similar method, which, like the ESR meter, also has high consumption due to the graphic display installed in it. Feelings from the remodel were only positive. I only charged it once in six months. The device was equipped with a step-up DC-DC converter that converts 3.7 volts at the battery output into 9 volts, necessary for the operation of the device.
ESR meter development board
In this case, my device will have a double voltage conversion: first from 3.7 volts to 9 volts, although I may also set the minimum voltage allowed for the input of the 7805 CV stabilizer to 7.5 volts; the device circuit is now powered from this stabilizer. The device itself, as can be seen in the photo, is initially powered by a Krohn battery, which, as is known, has a relatively small capacity.
The supply voltage of this microcircuit allows it to be powered directly from 9 volts, but the fact is that as the battery discharges, I noticed that the measurement readings begin to slowly float away. To combat this, a 7805 stabilizer was installed, which, as you know, produces a stable 5 volt output.
Switch with protection against accidental activation
Also, due to the fact that you often have to carry the device with you in a briefcase, for repairs on the road, and there have already been cases of spontaneous switching on of the switch, and accordingly the Krona battery dropped to zero, which now, when switching with this switch, 2 power lines, a multimeter and the device itself would be no longer desirable, since in this case, you would have to buy two crowns, costing 45 rubles.
Switching with a switch for 2 groups of contacts
It was decided to simply glue two self-tapping screws from the cooler mount in the computer power supply to the edges of the switch using hot-melt adhesive. The microcircuit used in the device is widespread and quite cheap; I purchased it for only about 15-20 rubles.
The whole device cost me, taking into account the free multimeter, probes - tweezers from Ali Express, costing 100 rubles, and the cost of parts for assembling the device, and the Krona battery, in total it took about 150 rubles, in total everything needed cost a ridiculous amount of 250 rubles.
Tweezers for measuring capacitors on a board
Which has already paid off with the use of the device in repairs for a long time and many times. Of course, someone who has the opportunity and desire to purchase an ESR micro can now say why I need these inconveniences, every time converting from milliVolts to milliOhms, although this is not required, as I wrote above, if I can immediately see on the purchased device , ready-made values.
ESR Value Table
The fact is that such devices incorporate a microcontroller, and during measurement they are connected directly, so to speak, by the “port” of the microcontroller to the capacitor being measured. What is extremely undesirable, it is enough not to discharge the capacitor once after de-energizing the circuit before measurement, by shorting its terminals with a metal object, for example a screwdriver, as we risk getting a non-working device.