Analog oscilloscope
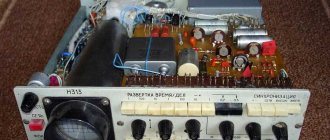
It is also called a cathode ray oscilloscope , since it consists of a cathode ray tube. Essentially, a cathode ray tube is a small kinescope on which we can observe any change in the electrical signal.
Any oscilloscope has a screen. It can be built-in, or it can be your desktop computer monitor or laptop display. In our case, in the photo we see that our oscilloscope has a round screen. The signal that appears on such a screen is called an oscillogram .
To measure electrical signals, we need a special probe for an oscilloscope. Such a probe is a cable of two wires, one of which is signal and the other is neutral. The neutral wire is also often called "ground".
More modern probes already look like this.
And here is the probe connector itself
This end of the probe connects to the oscilloscope and is fixed with a slight clockwise turn.
What to do if you don’t remember which wire from the probe is signal and which is neutral? This is determined very simply. Since a person is always in an electromagnetic field, he is a kind of receiving antenna and can cause interference. Touching the signal probe of the oscilloscope, we will see on the screen that the signal is very distorted.
When touching the neutral wire, the signal on the oscilloscope would remain as it was. That is, pure zero.
How to measure DC voltage with an analog oscilloscope
In order to measure DC voltage, we must switch the oscilloscope to DC mode, which means "direct current". This is done differently in different models, but this switch is a must-have in every oscilloscope.
Let's look at a real example of how DC voltage can be measured. For this we need a DC source. In this case, I will take a laboratory power supply. I set the voltage value on it to 1 Volt.
Now you need to select the measurement scale. If we want one side of the square to be equal to 1 Volt, then we set the scaling factor to 1:1. In this case, I set the vertical scan switch to one.
Next, we connect the signal wire of the oscilloscope to the “plus” of the power supply, and the zero wire to the “minus” of the power supply. Next we see this picture.
As you may have noticed, a DC waveform is a straight line parallel to the horizontal axis (X-axis). On the vertical axis (Y-axis) we see that the signal has risen by exactly one cell. We set the Y scaling factor so that 1 cell is 1 Volt. Therefore, in our case, the signal increased by exactly 1 cell, which tells us that this is an oscillogram of a direct current of 1 Volt.
I can also change the ratio. For example, I bet on 2. This means that 1 square will already be equal to 2 Volts.
Let's see what happens to a signal with a voltage of 1 Volt
Here we see that its value has dropped by 2 times, since we took the ratio 1:2, which means 1 square is equal to 2 Volts. Thanks to vertical scan scaling, we can measure signals with voltages of up to 1000 volts!
What happens if we connect the signal wire of the oscilloscope to the “minus” of the power supply, and the zero wire to the “plus” of the power supply? In this case, the oscillogram will “break through the floor” and simply show negative values. Nothing wrong with that. Here we see the value of “-2” Volt.
How to measure AC voltage with an analog oscilloscope
To measure alternating voltage, we will need to switch the oscilloscope to the AC measurement mode - “alternating current”. If you just want to observe the waveform, then you don't need to know which oscilloscope wire to poke where. Let's measure the alternating voltage from a step-down transformer, which is connected to a 220 Volt network.
We remove the voltage from the secondary winding of the transformer and see this oscillogram.
In theory, there should be a pure sine here. Either the transformer is distorting the signal, or something is wrong at the power plant. Unclear. Well, okay, the main thing is that we took an oscillogram of alternating voltage from the secondary winding of the transformer.
In this case, we can easily determine the period of the signal and its frequency. The horizontal scan switch along the time axis will help us with this
We see that its value is 5. This means that one square along the “X” axis, that is, along the time axis, will be equal to 5 milliseconds or 0.005 seconds.
The period is the time after which the signal repeats. Denoted by the letter T. In our case, the period is equal to 4 squares.
Since one square in our case is equal to 0.005 seconds, it turns out that T = 0.005 x 4 = 0.02 seconds. From here you can find out the frequency of the signal.
Where
V is the frequency, Hz
T—signal period, s
For this case
V=1/T=1/0.02=50 Hz. A transformer only changes the amplitude of the signal, but does not change its frequency. Therefore, the frequency in our network is 50 Hertz, which was confirmed by the oscilloscope.
What is measured in hertz?
Hertz
(Russian designation:
Hz
, international designation: Hz) - a unit of frequency of periodic processes (for example, oscillations) in the International System of Units (SI) as well as in the CGS and MCGSS units.
Hertz
is a derived unit that has a special name and designation.
Interesting materials:
How to make a good ending in the subway, a ray of hope? How to make a good bubble bath? How to make a Kinder surprise out of paper? How to make a pickaxe in The Escapists? How to make a Chinese keyboard? How to make a keyboard like an iPhone? How to make paper glue with your own hands? How to make glue for cardboard? How to make wallpaper glue? How to make glue in Fallout 4?
Digital oscilloscope
A digital oscilloscope is an oscilloscope built using digital circuitry. Its main difference from analog is that it contains digital signal processing. A digital oscilloscope can record, pause, auto-fit, and measure the signal of interest. And this is only part of the functions!
How to prepare a digital oscilloscope for use
Turn on the oscilloscope and connect the probe to any of the channels. I connected the probe to the first channel (CH1)
There is a divider on the dipstick. Set its slider to 10X. The oscilloscope should also have a 10X divider by default. If this is not the case, look for it in its settings and set it to “10X” in the channel characteristics.
Every normal digital oscilloscope has a built-in square wave generator with a frequency of 1000 Hertz (1 kHz) and a voltage amplitude of 5 Volts. Most often this generator is located in the lower right corner. In our case it is called Probe Comp. We cling to it with a probe.
Everything should look something like this:
Something is happening on the display at this time.
This oscilloscope has a magic button that I'm crazy about. This is the Autoscale signal positioning button. Clicked this button
I agreed with the terms of automatic signal positioning
and you're done!
But what is it? We must have a smooth rectangular periodic signal! The whole problem is that the oscilloscope probe introduces distortions into the signal itself, therefore, it is advisable to correct it each time before work .
Modern probes have a small screw sharpened to fit a thin screwdriver. Using this screw we will adjust the dipstick.
Let's spin it and see what we get on the display.
Whoa, I turned the screw too much.
We twist it a little in the opposite direction and align the signal vertices horizontally.
Here! It's a completely different matter! On the display we have smooth rectangular signals, therefore at this stage the digital oscilloscope is completely ready for operation.
How to measure DC voltage with a digital oscilloscope
So, first of all, we choose what voltage we are going to measure. This is done using the Coupling button (press the H1 key). DC - direct current, which in English means “direct current”.
Windows pop up on the right of the screen, and we select DC (press the F1 key)
That's it, after this our oscilloscope is completely ready to measure direct current.
Where will we get direct current from? I have a power supply for this. Let's set it to 5 Volts as an example.
We connect the probes of the power supply and the oscilloscope. It is advisable to connect the signal probe of the oscilloscope to the red positive crocodile of the power supply probe, and connect the black probe (ground) to the negative black crocodile.
Looking at the oscilloscope display
What do we see here? And here we see an oscillogram of constant voltage . Constant voltage is a voltage that does not change over time.
What you should pay attention to? Of course, at the price of division. One vertical square is equal to 2 Volts. If we count from the center of the intersection of thick dashed lines, then the oscillogram is at a height of 2.5 sides of the square. This means the voltage will be 2.5x2=5 Volts. Since I'm too lazy to count, I display these oscilloscope readings directly on the screen (lower left green frame).
How to Measure AC Voltage with a Digital Oscilloscope
For experiments, I will take LATR (Laboratory Autotransformer). As you remember, LATR lowers or increases the alternating mains voltage.
We set the voltage on the LATR to 100 Volts.
On the oscilloscope we switch to AC, which means alternating current - alternating current.
We cling to the output connectors of the LATR and observe the following picture.
Using the “Measure” button, I displayed some parameters of interest to us:
Vk is the rms voltage value. In this case, it shows us the voltage that we supplied from LATR - this is 100 Volts.
F is frequency. In this case, the network frequency is 50 Hz. LATR does not change the network frequency.
T is the period. T=1/F. As you and I can see, the voltage frequency in the network is 50 Hertz. The period is 20 milliseconds. If we divide one by 20 milliseconds, then we will get the signal frequency.
How to display all signal parameters
We will consider all our measured parameters using a specific example. To do this, we will use a frequency generator with a preset frequency of 1 Megahertz (or 1000 KHz) with a rectangular signal shape:
The signal from the frequency generator looks like this on the oscilloscope screen.
Where is the correct square wave signal? Here you go... Nothing can be done about it. This is, was and will be the case for all rectangular signals. This occurs due to imperfection of circuits and radioelements. Such an oscillogram is drawn especially well at high frequencies, as in our example.
Okay, let's output all the signal parameters that our oscilloscope can output. To do this, press the “Measure” button, which is from English. means "to measure"
Next, press the “Add” button (from English - add), using the auxiliary key H1
And then press the “Show All” button (from English - show everything) using the auxiliary key F3
As a result of all these operations, a plate with the measured signal parameters will pop up:
Description of signal characteristics
As you know, an oscilloscope shows us the change in signal voltage over time. Therefore, signal parameters are mainly divided into two types:
— Amplitude
— Temporary
Let's look at the main ones. Let's start from left to right.
Period - from English. period. The signal period is the time during which the signal repeats. In our case, the period is denoted by the letter “T”.
To calculate the period ourselves, we need to know the horizontal value of one cell. You can find a hint at the bottom of the waveform. I marked it in a yellow rectangle
Therefore, one cell horizontally is equal to 500 nanoseconds. And since our period lasts exactly two cells, that means 500 x 2 = 1000 nanosecond or 1 microsecond.
Do our calculated readings agree with the readings of automatic measurements? Let's look and check.
One hundred percent hit! By the way, so that there are no further questions, I provide a small sign.
"Pico" - letter "p"
"Nano" - letter "n"
"Micro" is designated by the letter "u" , as in the marking of modern capacitors.
"Millie" - letter "m" .
Freq. The full name frequency is from English. frequency. Denoted by the letter "F". The frequency can be very easily calculated using the formula, knowing the period T.
F=1/T
In our case we get 1/1x10-6=106=1 Megahertz (MHz). Let's look at our automatic measurements:
Well, isn't it a miracle? 
The next indicator is Mean. In our case, it is simply designated by the letter “V”. It means the average value of the signal and is used to measure DC voltage. At the moment, this parameter is not of interest, because alternating current is measured and some kind of wool is shown in the value of this signal. Direct current measures normally, you can display this parameter on the display, which is what we did in the previous article:
Another interesting parameter: PK-PK . It's called Peak-to-Peak and shows the voltage from peak to peak. Denoted as Vp . What this peak-to-peak voltage is is shown in the waveform below:
Since we see that the value of our square is 1 Volt (bottom left)
Then you can calculate the voltage from peak to peak. It will be somewhere around 5 Volts. Checking the automatic measurement
Almost to the neck!
The remaining signal parameters are not so important for novice electronics engineers.
Pros and cons of a digital oscilloscope
Let's start with the positives
- Recording, stopping, automatic measurements and other features - this is not the whole list of what a digital oscilloscope can do
- The dimensions of a digital oscilloscope are much smaller than an analog one
- Less power consumption than an analog oscilloscope
- Liquid crystal display, as opposed to the kinescope display of an analog oscilloscope
Minuses
- Expensive
- Discrete signal rendering. Although expensive models are in no way inferior to analog ones in terms of signal rendering.
Where to buy a digital oscilloscope
Naturally, on Aliexpress, since in our online stores their price is two or even three times higher. Also very good reviews about the Hantek oscilloscope, the characteristics of which are even better than those of my OWON:
You can view it on Aliexpress using this link.
Controls
On the front panel of any oscilloscope there are:
- adjusting screen brightness;
- image focus control;
- horizontal offset;
- vertical offset;
- scan scale control;
- input divider regulator;
- input of the signal under study;
- input for external synchronization;
- Ground terminal:
- input control button (open/closed);
- synchronization control.
Front panel of a single channel oscilloscope
All of the above is present in any single-beam device; for multi-channel devices, the number of controls increases in proportion to the number of channels; depending on the model, new functions can be added. Digital models have similar controls, which are complemented by the ability to perform mathematical calculations and analyze waveforms.
Video
Organic Shop Kitchen Restoring Night Cream for the face “Bayu-Bai”, 100 ml
130 ₽ More details
ARAVIA Professional Intensive Moisture Face Cream with urea (10%), 150 ml
405 ₽ More details
Graph paper
Story
The difficulty in creating an oscilloscope was that the recording parts of the first instruments had great inertia. William Duddell was able to cope with this. In 1897 he used a mirror measuring element. This is how the light beam device was created. A photosensitive plate was used as a receiver. The sent signal was recorded on it. Only the invention of the kinescope by Karl Brown allowed Jonathan Zenneck to perform horizontal scanning in it. So, in 1899, a device similar to modern oscilloscopes appeared. Already in the 30s of the next century, Vladimir Zvorykin made a breakthrough in this area, creating his own kinescope, which was more reliable.
How are measurements taken?
Working with an oscilloscope involves preliminary preparation: selecting a synchronization mode, input, measurement scale, then you can begin measurements.
How to measure voltage
After removing data from the information input by adjusting the scan synchronization, a stable image is obtained, which is combined with the scale on the screen. Take several measurements and calculate the average value. The effective value is displayed according to the measurement scale.
How to measure frequency
By setting up a good quality picture in which the period of signal change is visible, aligning its beginning with the beginning of the horizontal ruler and knowing the units of the measurement scale, you can calculate the frequency, which is inversely proportional to the period.
How is phase shift determined?
Having stabilized the image with two signals (this is why a dual-beam oscilloscope is needed), for convenience it is necessary to separate the amplitude values and combine the beginnings of the periods; a phase shift will be visible on the screen. To calculate the value you can use the formula:
Where:
- a is the distance in divisions between the points of passage of the zero mark of the oscillograms,
- b – period in scale divisions.
If you only have a single-channel device, it is possible to determine the phase shift using Lissajous figures, but this is more difficult.
Phase shift between sinusoidal signals
Settings
Before working with the device, its inputs are calibrated using the built-in calibrator. When calibrating high-frequency models, use a cable with two connectors. The connectors are connected to the output of the calibrator and the input of the device. When calibrating low-frequency devices, you need to briefly apply the probe to the output of the calibrator. The following steps are followed:
- the “volts/div” regulator sets the calibrator signal to 3-4 divisions of the display grid;
- the channel is switched on to alternating voltage, and the appearance of the signal is monitored;
- the sweep regulator is set so as to observe 6-7 pulse periods;
- an exact match of the signal by divisions is noted over the interval of the obtained periods (±4 divisions from the center);
- if there is a mismatch, use the smooth adjustment knob to achieve the desired position of the periods, ensuring that the signal amplitude corresponds to the values indicated on the calibrator;
- in case of discrepancy between the amplitude values, they are brought back to normal using the “volts/div” regulator.
With a channel sensitivity of 250 mV, a signal with an amplitude of 1V occupies 4 scale divisions. If so, then the device has been calibrated.

