When studying electronics, the question arises of how to read electrical diagrams. The natural desire of a novice electronics engineer or radio amateur is to solder some interesting electronic device. However, at the initial stage, sufficient theoretical knowledge and practical skills are, as always, not enough. Therefore, the device is assembled blindly. And it often happens that a soldered device, on
which was spent a lot of time, effort and patience, does not work, which only causes disappointment and discourages a novice radio amateur from getting involved in electronics, having never experienced all the delights of this science. Although, as it turns out, the scheme did not work due to a mere trivial mistake. It would take a more experienced radio amateur less than a minute to correct such an error.
This article provides useful recommendations that will help minimize the number of errors. They will help a novice radio amateur assemble various electronic devices that will work the first time.
How to learn to read electrical diagrams
Any radio-electronic equipment consists of individual radio components, soldered (connected) to each other in a certain way. All radio components, their connections and additional symbols are displayed on a special drawing. Such a drawing is called an electrical diagram. Each radio component has its own designation, which is correctly called a conventional graphic designation, abbreviated as UGO. We will return to UGO later in this article.
In principle, two stages can be distinguished in improving the reading of electrical circuits. The first stage is typical for installers of radio-electronic equipment. They simply assemble (solder) devices without delving into the purpose and operating principle of its main components. In fact, this is a boring job, although soldering is good, you still need to learn. Personally, I find it much more interesting to solder something that I fully understand how it works. There are many options for maneuvers. You understand which value, for example a resistor or capacitor, is critical in this case, and which one can be neglected and replaced with another. Which transistor can be replaced with an analogue, and where should a transistor of the specified series be used only. Therefore, I personally prefer the second stage.
The second stage is inherent to developers of electronic equipment. This stage is the most interesting and creative, since one can improve endlessly in the development of electronic circuits.
Entire volumes of books have been written in this area, the most famous of which is “The Art of Circuit Design.” It is to this stage that we will strive to approach. However, this will require deep theoretical knowledge, but it’s all worth it.
We will learn to read electrical diagrams from the simplest examples and gradually move forward.
Power supply designation
Any radio-electronic device is capable of performing its functions only in the presence of electricity. There are fundamentally two types of electricity sources: direct and alternating current. This article deals exclusively with DC sources. These include batteries or galvanic cells, rechargeable batteries, various types of power supplies, etc.
There are thousands of thousands of different batteries, galvanic cells, etc. in the world, which differ in both appearance and design. However, they are all united by a common functional purpose - to supply electronic equipment with direct current. Therefore, in the drawings of electrical circuits, sources are designated uniformly, but still with some minor differences.
It is customary to draw electrical circuits from left to right, that is, the same way as writing text. However, this rule is not always followed, especially by radio amateurs. But, nevertheless, this rule should be adopted and applied in the future.
A galvanic cell or one battery, no matter “finger”, “pinky” or tablet type, is designated as follows: two parallel lines of different lengths. A longer dash indicates the positive pole – plus “+”, and a shorter one – minus “-”.
Also, for greater clarity, battery polarity signs may be indicated. The galvanic cell or battery has a standard letter designation G.
However, radio amateurs do not always adhere to this encryption and often write the letter E instead of G, which indicates that this galvanic element is a source of electromotive force (EMF). The EMF value may also be indicated next to it, for example 1.5 V.
Sometimes, instead of a picture of the power supply, only its terminals are shown.
A group of voltaic cells that can be recharged repeatedly by a battery. In the drawings of electrical circuits they are designated similarly. Only between the parallel lines is a dotted line and the letter designation GB is used. The second letter just means “battery”.
Features of reading circuits
In circuit diagrams, conductors (or tracks) are indicated by lines.
This designates conductors that intersect, but they do not have a common connection and are not electrically connected to each other.
And this is what they look like if there is a connection between them. The black dot is a node in the circuit. A node is a connection of several conductors or parts together. They are electrically connected to each other.
Common point
Beginner radio amateurs often have a question: what is this symbol on the diagram?
This is the common point (GND, ground). Previously, it was called the common wire. This is how a single power wire is designated. Usually this is a minus of nutrition. Previously, in the diagrams they could make the common wire and the power plus. In this case, the diagram without a common point would look like this:
A common point with unipolar power supply looks visually better and more compact than if you simply make a single line between them.
It is also called a common point because any other points on the diagrams can be measured relative to it. For example, place the multimeter probe on a common point, and with the second probe you can check any part of the circuit in the diagram.
Why can it be called ground (GND)? Previously, the chassis of the device body could be used as a common wire. This has caused confusion between grounding and earth. It is interpreted in the context of the schema. The circuit that was discussed above - the common point (ground) is simply a minus of the power supply. Another thing is bipolar current sources and grounding.
Bipolar power supply and common point
In a bipolar supply, the common point is the middle contact between plus and minus.
Grounding
An example of grounding would be a filter in computer power supplies. From the capacitor filter, noise goes to the power supply housing. This is grounding. And from the power supply they must go into the outlet if you have a ground connection, otherwise the body of the power supply itself may be energized. The currents there are not large, they are not life-threatening. This is done to reduce impulse noise in the power supply and safety.
Sometimes in power supplies, instead of the housing, noise from the capacitor goes to a common point. It all depends on the design and circuitry. In this case, there will be more interference than with grounding.
In general, there are different grounding connections on the diagrams. For example, in digital technology, analog ground is separated from digital ground. so as not to disrupt the operating modes of the circuit. Pulse noise can affect the analog part of the circuit.
Designation of wires and their connections on diagrams
Electrical wires perform the function of combining all electronic elements into a single circuit. They act as a “pipeline” - they supply electronic components with electrons. Wires are characterized by many parameters: cross-section, material, insulation, etc. We will deal with installation flexible wires.
On printed circuit boards, conductive paths serve as wires. Regardless of the type of conductor (wire or track), in the drawings of electrical circuits they are designated in the same way - a straight line.
For example, in order to light an incandescent lamp, it is necessary to supply voltage from the battery using connecting wires to the light bulb. Then the circuit will be closed and a current will begin to flow in it, which will cause the filament of the incandescent lamp to heat up until it glows.
The conductor should be denoted by a straight line: horizontal or vertical. According to the standard, wires or live paths can be depicted at an angle of 90 or 135 degrees.
In branched circuits, conductors often intersect. If an electrical connection is not formed, then a dot is not placed at the intersection.
If an electrical connection is formed at the intersection of conductors, then this place is designated by a point called an electrical node. Several conductors can intersect at the same time in a node. Here I advise you to get acquainted with Kirchhoff's first law.
Common wire designation
In complex electrical circuits, in order to improve the readability of the diagram, the conductors connected to the negative terminal of the power source are often not shown. And instead of them, signs are used indicating the negative wire, which is also called common or ground or chassis or ground.
Next to the grounding sign, especially in English-language circuits, there is often the inscription GND, short for GRAUND - ground.
However, you should know that the common wire does not have to be negative; it can also be positive. Especially often, the positive common wire was mistaken for the positive common wire in old Soviet circuits, which predominantly used transistors of p–n–p structure.
Therefore, when they say that the potential at some point in the circuit is equal to some voltage, this means that the voltage between the indicated point and the “minus” of the power supply is equal to the corresponding value.
For example, if the voltage at point 1 is 8 V, and at point 2 it is 4 V, then you need to install the positive probe of the voltmeter at the corresponding point, and the negative probe to the common wire or negative terminal.
This approach is quite often used, since it is very convenient from a practical point of view, since it is enough to indicate only one point.
This is especially often used when setting up or adjusting radio-electronic equipment. Therefore, learning to read electrical circuits is much easier by using potentials at specific points.
Programs for drawing diagrams
List of programs for free use:
- Freeware - the program is not limited in functionality and can be used for personal purposes without purchasing the full package;
- Open Source is an “open access” application in which you are allowed to add changes by adjusting the software to suit your own purposes. There are both paid and free versions;
Drawing up a drawing in the program
- GNU GPL - the program is completely free and easy to use;
- Public domain - almost similar to the previous application, you can download a free license on the Internet;
- Ad-supported - the program is fully functional, but sometimes it contains advertising; to remove it, you need to pay;
- Donationware - the application is free to use, but the author of the service offers to make voluntary donations.
You may be interested in this Connection rn 113
ES semi-automatic welding machine
Conventional graphic designation of radio components
The basis of any electronic device is radio components. These include resistors, LEDs, transistors, capacitors, various microcircuits, etc. To learn how to read electrical circuits, you need to know well the graphic symbols of all radio components.
For example, consider the following drawing. It consists of a battery of galvanic cells GB1, resistor R1 and LED VD1. The conventional graphic designation (UGO) of the resistor looks like a rectangle with two terminals. In the drawings it is designated by the letter R, followed by its serial number, for example R1, R2, R5, etc.
Since an important parameter of a resistor, in addition to resistance, is power dissipation, its value is also indicated in the designation.
The LED UGO has the shape of a triangle with a line at its apex; and two arrows, the tips of which are directed from the triangle. One terminal of the LED is called the anode, and the second is called the cathode.
An LED, like a “regular” diode, passes current in only one direction - from the anode to the cathode. This semiconductor device is designated VD, and its type is indicated in the specification or in the description of the circuit. The characteristics of a particular type of LED are given in reference books or “datasheets”.
Possible mistakes
The main problems that may arise when drawing up an ES:
- incorrect drawing of an element, damaging the electrical circuit or connection between components in the PDS;
- location of component contacts “ outside the electrical circuit ” in the electronic passport system;
- incorrect type of arrow showing the orientation of the signal in the electrical circuit;
- incorrect direction of telecommunication lines at arbitrary angles.
Thus, drawing up electrical plans on your own, without experience, is quite difficult. To do this, you need to choose the program that is easiest to manage, and also study all the basics of work in more detail. For example, how the diagram indicates treatment or diagramming methods.
How to read electrical diagrams for real
Let's return to the simplest circuit, consisting of a battery of galvanic cells GB1, resistor R1 and LED VD1.
As we see, the circuit is closed. Therefore, an electric current I flows in it, which has the same value, since all elements are connected in series. The direction of electric current I is from the positive terminal GB1 through resistor R1, LED VD1 to the negative terminal.
The purpose of all elements is quite clear. The ultimate goal is to light up the LED. However, so that it does not overheat and fail, the resistor limits the amount of current.
The voltage value, according to Kirchhoff’s second law, may differ on all elements and depends on the resistance of resistor R1 and LED VD1.
If you measure the voltage on R1 and VD1 with a voltmeter, and then add the resulting values, their sum will be equal to the voltage on GB1: V1 = V2 + V3.
Let's assemble a real device using this drawing.
We figured out how to read electrical circuits with a minimum set of radio components. Now we can move on to a more complex option.
Adding radio components
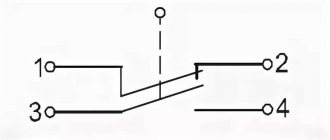
Consider the following circuit, consisting of four parallel branches. The first is only a battery GB1, with a voltage of 4.5 V. In the second branch, normally closed contacts K1.1 of the electromagnetic relay K1, resistor R1 and LED VD1 are connected in series. Next in the drawing is the SB1 button.
The third parallel branch consists of an electromagnetic relay K1, shunted in the opposite direction by a diode VD2.
The fourth branch has normally open contacts K1.2 and buzzer BA1.
There are elements here that we have not previously considered in this article: SB1 is a button without a fixed position. While it is pressed, the contacts are closed. But as soon as we stop pressing and remove our finger from the button, the contacts open. Such buttons are also called tact buttons.
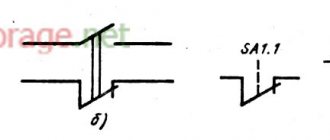
The next element is the electromagnetic relay K1. Its operating principle is as follows. When voltage is applied to the coil, its open contacts close and its closed contacts open.
All contacts that correspond to relay K1 are designated K1.1, K1.2, etc. The first digit indicates that they belong to the corresponding relay.
Boozer
The next element, previously unknown to us, is the boozer. The buzzer can to some extent be compared to a small speaker. When an alternating voltage is applied to its terminals, a sound of the corresponding frequency is heard. However, in our circuit there is no alternating voltage. Therefore, we will use an active buzzer, which has a built-in alternating current generator.
Passive buzzer - for alternating current .
Active boozer – for direct current.
The active buzzer has a polarity, so you should adhere to it.
Now we can look at how to read an electrical diagram as a whole.
In the initial state, contacts K1.1 are in the closed position. Therefore, current flows through the circuit from GB1 through K1.1, R1, VD1 and returns again to GB1.
When button SB1 is pressed, its contacts close and a path is created for current to flow through coil K1. When the relay is energized, its normally closed contacts K1.1 open and its normally closed contacts K1.2 close. As a result, the VD1 LED goes out and the BA1 buzzer sounds.
Now let's return to the parameters of the electromagnetic relay K1. The specification or drawing must indicate the series of the relay used, for example HLS‑4078‑DC5V. Such a relay is designed for a nominal operating voltage of 5 V. However, GB1 = 4.5 V, but the relay has a certain operating range, so it will work well at a voltage of 4.5 V.
To select a buzzer, it is often enough to know only its voltage, but sometimes you also need to know the current. You should also not forget about its type - passive or active.
The VD2 diode of the 1N4148 series is designed to protect elements that open the circuit from overvoltage. In this case, you can do without it, since the circuit is opened by the SB1 button. But if it is opened by a transistor or thyristor, then VD2 must be installed.
CS-CS.Net: Laboratory of the Electroshaman
Example of a bad electrical panel diagram
Heh! It’s called “you’ve been waiting for this for a long time and finally got it.” As you know, I can not only assemble a shield for you, but sometimes check your shield diagram. And sometimes I do it for free if the scheme is simple and correct. How much does it take to write: “That’s right, just don’t forget about the double tips here, and here you’ll most likely need to install a cross-block”?
But you, my dear customers, love to turn SIMPLE and CLEAR tasks into complex ones. As, for example, we have already found out, people became completely dumb and stopped reading. It’s easier for them to ask the same thing 50 times than to read the caption under the photo. We need to return the phrase “Two hundred and forty monkeys stuck a banana up their ass” under the rules for ordering billboards and consultations and communicate only with those who have read it, heh.
In general, my dear comrades. I love you, but you tormented me with your drawings! And today I will show several muddy diagrams to show the errors in their drawing. And since the most important rule of spanking is not just to scold and say that all this is bullshit, but also to show how to do it right, I decided to talk a little about Visio, in which it is convenient to draw everything in a few clicks with the mouse and much more more convenient than in heavy AutoCAD.
The main problems with drawing diagrams. Installation, Schematic and Block diagrams.
Let's start with the right one. Everyone loves abstruse words, such as: “Shield diagram”, “Shield project”, “Shield drawing” and other beautiful ones. You read the soap: “...check my shield diagram,” and there are photoshopped pictures, like in the title photo of the post.
So it turns out that there can be several (more precisely, many) schemes. And if you are talking about a scheme, then do not forget to specify which one.
This is an electrical circuit diagram (taken from a post about connecting pulse relays):
Diagram of a panel with pulse relays for three groups of light
Such circuits are needed more for electronics, where there are many different and complex connections. On such a diagram you must show EVERY wire and all its connections. We almost don’t need such circuits, because in our switchboards, in most cases, the power comes in one heap: all three phases went through the input, went to some kind of cross-module and went through the difautomatic switch to the load.
Therefore, for our shields, block diagrams in which the main components of the shield are shown in squares will be more convenient. This is similar to programming flowcharts: the exact lines of code are not written, but the general logic of the operation is shown.
For example, here is a flowchart from some technical assignment for two non-priorities. From the input switch, power went to the indicator light and the OM-310 power limiter, from where, through two contactors, it went to two non-priorities:
Example of work in Visio: power distribution block diagram
Do I need to show all four pins of the light bulb here, like in the circuit diagram? No: it’s already clear that they need to be connected to 3L+N. Is it necessary to show the wiring of the OM-310 and two contactors if it exactly matches the connection diagram from the instructions? For this scheme, I think not.
In general, there are single-line ones purely for electrical purposes. But in them, more emphasis is placed on drawing diagrams in accordance with GOST standards, rather than on detailing. Try to draw it with a single line and you will die bleeding. And in the flowchart it is simple and clear.
If you want to show where the power goes along the panel, then use a block diagram. Draw squares and connect them with arrows as you would describe it in words: “Power from the input switch passes through three VARs, three UZMs and goes to stabilizers. After them it goes to the cross-module. From the cross-module it goes to three RCDs. At the first RCD...”
And the third diagram, if you can call it that, is the wiring diagram . It does not show each individual wire, but it does show the location of all the elements of the panel (or something else). So it can also be called more abstractly: “assembly drawing”. Here we don't need to know where each wire will go separately. We can simply draw a thick line and say: “this is the wiring harness, it goes here between the machines, and here behind them.”
Here I once, without 1SKi, drew a diagram for installing a panel for an apartment, which I remodeled in 2009:
Layout of machines in the panel
Therefore, the first major mistake of everyone who tries to draw a “shield diagram” is that they combine the block diagram and the switchboard wiring diagram in one pile. Like this:
Error - wiring diagram and electrical diagram combined into one
This diagram reminds me of the diverging pipelines from the RBMK reactor. Here (the photo was stolen from the Lana-Sator magazine and saved as a copy on the hosting; thanks, Lana!):
Outgoing pipelines from the RBMK reactor (photo by Lana Sator)
Is it possible to understand something here? Well, you can if you have a lot of desire and time. It’s especially cool to follow every line and its bends. But if you turn it into two separate circuits, then it would be much clearer that this is an ordinary three-phase shield according to the scheme “Input - metering - protection - cross-module - difautomatic devices”. And then, when this becomes clear, discuss only the layout of the shield. For example, take a single 4x11 cross-module and stick it into the empty space between the switch, and place the VARs and UZMs on the second half of the rail.
But this is the opposite example. One friend sent me this creation:
Error - the location of the shield elements is shown, but there are no connections
Initially, there were no questions about it: the man arranged everything according to the slats, and the wiring diagram of the shield came together - there were enough slats for the entire module. But he asks me to check the shield diagram. I could answer “Yes, everything is OK - it will fit into the shield, you can assemble it.” But I understand that we are talking about the fact that you need to check where the current is going and whether all the components are logically arranged correctly and whether their values are chosen correctly...
So I write to him: “I need a block diagram, I need to understand where everything comes from and flows to.” And he sends THIS:
Error - nothing is clear
Guess it yourself, Electroshaman.
I swore. He made me draw a flowchart on a piece of paper. And - voila - look how everything became clear right away! There is an error only in the input part up to the UZOs - there is a confusion with the network-generator switching and input protection.
The customer redrew the normal block diagram of the shield
The entire correspondence took about a week. Only because everyone is trying to invent everything from scratch instead of reading. Well, heh, now there will be something to read!
Here is an example of a good scheme. Look how simple and concise it is. And immediately everything is clear and understandable. No problem. These are the guys who get simple answers: “It would be nice for the light to also be under an RCD; There are no UZOs for 32 and 50A, take 40 and 63A; don’t forget to count the tires.”
Block diagram of the shield, made by hand - everything is clear
So don't be offended, guys, when I swear at your schemes. If I see a mess, as I showed, I will swear. Do you want a consultation (especially if it’s for nothing)? Well, damn it, draw a flowchart on a piece of paper if you don’t know how to draw. It will be simpler and clearer than all these drawing debaucheries.
Microsoft Visio. General concepts and thoughts.
For those who want to draw a house plan, a block diagram, some simple drawings and other little things, there is a cool program - Visio. I'm working with the '2007 version, where the files were in vsd format, not vsdx: this program is lightweight and not overloaded with a confusing interface with a ribbon menu. I will talk about her.
Here are the most important advantages of this program:
- She can print what she draws on a 1:1 scale. If you drew a crap of 1.27 millimeters, then on print it will be the same size if you set the scale correctly.
- It is vectorial: each drawn object can be moved, scattered over layers (there are layers, like in AutoCAD) and transferred to different positions in depth (back and forth), changing how the drawn things are superimposed on each other.
- The standard libraries have a bunch of different convenient symbols and templates. You can easily and quickly draw a floor plan without inventing symbols for the house’s structures. Some elements in Visio have customizable features. For example, you can right-click on a door and change its location (inside-out, left-right).
- Visio can work with data: you can bind “Property = Value” pairs to each shape or link it to a database. You can do a convolution: count the drawn figures to get a certain total of “total: this is three, this is five.”
- There are many functions typical for AutoCAD: snapping to different places of objects (edges, center, intersection), centerlines.
- Can work with flowcharts and various diagrams right out of the box. You can set the mode for placing shapes on a sheet - and Visio itself will try to connect them with lines. You can draw a time chart, a Gantt chart - and they will be drawn in proportion to the specified time or other parameters.
- There is built-in OLE and VBA. Everything that doesn’t exist can be programmed. My CS CRM draws machine labels in Visio automatically. This was mentioned here.
If we take the general concept, then you create a document in Visio, adjust its scale and units of measurement, and draw. You can draw in two ways: either drag and drop ready-made shapes from the template library or draw your own things from scratch. to group shapes is very useful here : you can select several shapes (or lines/circles/squares) with the mouse and group them into a single thing, which is then dragged and resized as one. This way you can create your own object (for example, a clever lamp), and then accumulate it many times.
For each object, you can customize the color and thickness of edge lines, fill, font and text format. That is, if you want, you can do simple layout in Visio: throw rectangles in the places where the texts should be, and enter what you need into them. This is how I made a sign inside the floor panel in this post on the title photo.
In general, this is a very successful scriber for EVERYTHING. Almost all the diagrams and drawings in my blog posts are made in it. Once I even used Visio to very accurately mark the holes (here in this post): I schematically depicted a connector with its protruding pin so that I could take into account the position of this pin, and then I threw these connectors so that their pins do not interfered with each other. Then I printed everything out on a 1:1 scale and punched holes according to the printout.
The main Visio window with the created document looks like this:
Visio is a convenient drawing tool
On the left of the window is the shape selection area, and on the right is the document page. The figures are collected into some logical groups (sets), separated by stripes. If you click on this strip, the group that is hidden under it opens. If you have a lot of groups of shapes open, you can close some of them by right-clicking on the strip.
You can start a document with a blank sheet, but then no sets of shapes will be added to the document. Therefore, it is more convenient to start a document from the templates that Visio itself offers. They are in the drop-down menu under the create document button. In this case, you will immediately have a blank with the most suitable sets of figures.
You can add other shape sets to any created document. All of them are in the “File - Shapes” menu. There are a LOT of them there! Really GREAT! And on the Internet you can find additional sets that connect to Visio. Visio itself is designed in such a way that it copies all the shapes from the sets into our document. Therefore, even if you linked shapes from an external file, and then this file was moved or removed, then these shapes will not go anywhere from the document. It is very comfortable.
As I already said, for each shape you can set colors, type and thickness of lines, fill or font. You simply select it and use the buttons on the toolbar. Or, using the right button, you can open the figure properties window, where there are a variety of settings. A little later I will take screenshots of this window.
A Visio drawing can consist of multiple pages. Their number is not particularly limited. I haven’t tested this, but I think it will be easy to create a document of a hundred pages. Printing parameters and any layout settings are made for each page separately. This is very convenient because you can print different documents from one file if you want to keep the entire project side by side.
New pages can be added by right-clicking on the page tab at the bottom of the document. There you can rename it or configure page parameters.
Add a new page in Visio
Setting page parameters and document scale.
There are several important points in Visio, if you mess with them, you can get a printout in the form of a small square in the corner of an A4 sheet. One of them is page scale and document scale. And we’ll talk about them now.
What is the logic of work in simple scribers? You choose a working field, draw what you like on it, and then the scribe tries to fit it on one page of the printer. But it was not for nothing that I said that Visio can work perfectly with scales! Here it is not only “possible”, but also “ necessary ” to adjust the scale of the document and page! And Visio has a lot of tools for making a drawing in A0 format inside the program, and then printing it out in A4 format so that everything fits and nothing gets lost!
But if you want, you can do the opposite, bring an ordinary A4 sheet to dimensions of 300x800 meters and draw on it some kind of plan of a football stadium or something huge. In this case, all dimensions will be shown in real numbers (say 152.4 meters), and everything will be printed on A4.
In order to dig deeper into this, you need to go to the page settings menu. It is available either by right-clicking on the page shortcut, or from the “File” menu:
Calling Visio Page Settings
Important: in Visio, the physical size of the sheet of paper on which the document will be printed is separately configured, and the size of the working field of the document itself (where we will draw) and its scale are separately configured. They are not related to each other.
The first tab of the Page Setup window is “Printing Settings”:
Adjusting page sizes in Visio
Here you can choose how the document will PHYSICALLY be printed: on what printer (Visio will take into account its real parameters and the indentation from the edges of the sheet that the printer can make) and on what paper. Set the paper size to the one that will be loaded into your printer!
Later, if you want to make your Visio document smaller or larger, you can easily do so using the Zoom group of settings. Take a look: here I'll make Visio print the same A4 document on 16 of the same sheets. That is, increase it 4 times! =) After this, the sheets can be glued together and you can get a huge drawing.
We set a different page printing mode in Visio (one on several sheets)
The same settings can be turned in reverse: if someone gave me a plan in A0 format, then I can force Visio to print it on A4 sheet without loss.
I came across several plans in which large format paper was selected (A2, A1), and the drawing was in the upper left corner of this huge sheet and had small dimensions. This is mistake. When printing, Visio honestly tried to multiply this large sheet into several A4 pages (adjusting to the printer). So people made such a drawing so that it would occupy exactly one A4 sheet out of, say, 16.
Such documents cannot be corrected: if you tell Visio “print everything on A4”, then, of course, it will put the entire large sheet on one A4 sheet. And we will get what we see: an A4 sheet of paper, in the corner of which there will be a tiny little drawing - the one that used to fit on a whole sheet when printing 1:1, hehe. Don't do this!
But what should we do if we come across such a document, beaten by crooked hands? Stretch all objects to larger sizes? But this will not always work: some shapes are immediately set to dimensions that are a multiple of the current document scale, and then these dimensions cannot be changed.
Then it’s worth playing around with the dimensions of the Visio page itself! To do this we need a second window tab:
Setting page scales in Visio
Let me draw your attention once again: “Page size” is not the size of the sheet of paper in the printer on which we will print the document! Here we are talking about the size of the working field in Visio on which we will draw! If you specifically want to place a document in the same paper format on which you will print, select “Like a printer” and don’t worry about anything.
And if you want to adapt to some other format (for example, choose A3 and then print it as two A4 sheets), then choose the size you need or enter it yourself. And to correct those cases that I wrote about, there is an option “Resize by content”: the working field will adjust to what has already been drawn there, and we can then adjust the print settings so as to tell Visio: “But this is all that yes, fit it on one A4 sheet.”
Go ahead! I told you that in Visio you can do it in such a way that you can operate with real dimensions on an A4 sheet. Yes, you can. To do this, you need to adjust the document scale :
Inserted another page scale to draw the plan in real dimensions
This tab configures the document's units of measurement. If we need to draw something for marking (as I did), we set the scale to 1:1. And if it’s a football field or a summer cottage, then we play the way we want. In my example, I made the scale “1:100”, and the dimensions of my “sheet” became 21x29.7 meters - this is an A4 sheet, but measured (not enlarged!) in meters instead of centimeters. In these units I will begin to draw in it in the future, since I already need it that way.
Well, on the last tab that is important for us, you can customize the name of the page and select its type (front or backing - more on that later) and set the units of measurement.
Change page units and page type in Visio
These units do not affect the scale (we have already selected it), but rather affect the display. Let's say, if you are drawing a site plan, then it is more convenient for you to set the meters for yourself. And if you draw a house plan, then use millimeters, as is customary in construction. In these units, Visio will show you all the dimensions.
Now look how it looks in reality. I set all the parameters as shown in the screenshot: my document will be printed on A4, the working field will be like an A4 sheet, but in size 21x29.7 meters. And I want to see all sizes in millimeters.
We received the real dimensions of the object (in meters) on an A4 sheet
So Visio showed me the document grid in millimeters, as I asked. And the dimensions of the drawn rectangle are multiples of my scale: 8x2 meters! They are shown below and it is convenient to adjust the dimensions to the real ones.
That is, if you set the desired scale and adjust the sizes of the figures to match the real ones, you can easily draw everything you need in the real scale. This can be useful for calculating some distances or checking whether a 1.97 meter wide sofa will fit between a 0.8 meter wide wardrobe and a 1.58 meter wide table. In this case, you can print the entire drawing on A4 sheet =)
Setting shape properties (fill, font, lines).
Right in the middle of this post, I suddenly realized that I needed to make this section and be sure to show the grouping of shapes and all their settings. I took more screenshots. It's time to play with the shapes!
First, I'll show you something interesting. As I wrote above, some figures have rendering settings built into them. This applies to elements from standard Visio presets. For example, I took the “Two-position contact” figure and drew as many as three options for its display and position:
Set shape interactive properties in Visio
Using the right button, you can open the figure settings window (it is written specifically for it in the set of figures) and play around with the parameters:
Set shape interactive properties in Visio
There are such settings for relay coils, resistors (you can show it with a zigzag, as on imported circuits, or a rectangle, as on ours) and other elements (doors, for example). Very comfortably! While I didn’t know this, I drew what I needed to the contacts, rotated the doors on the plan using the “Rotate/Flip” menu to the desired position.
By the way, what are these dots and squares around the figure?
Move and resize a shape in Visio
And this is in order to change the size of the figure or rotate it. If you drag the shape by the squares along the edges, its size will change proportionally. If you drag the side ones, then only this side of the figure will change size. And if you hold down the circle with the mouse, you can rotate the figure.
The exact rotation angle will be shown in the status bar at the bottom of Visio. If you do not move the mouse cursor far from the figure, the rotation will occur in multiples of 5 degrees. And if you drag the mouse away, you can rotate it to any angle.
Additionally, during these operations (or when dragging figures), you can hold down the “Shift” key: then the movement will only occur at angles of 90 or 45 degrees. This is very convenient if we need to rotate something 45 degrees or move it strictly horizontally.
Each shape has a variety of settings that can be divided into three groups: text, lines, fill. Let's go through them. All these settings can be accessed either using the buttons on the toolbar, or through the context menu using the right button:
Shape Settings Menu
You can write it like this:
- Text—responsible for the font parameters used to write something on the figure. Formatting is similar to Word: Visio can separate paragraphs, indent and align them.
- Line—responsible for the parameters of the line that surrounds the figure (the boundaries of the figure). If we draw a rectangle, then its outer border will be considered a line. You can turn it off and get only the internal background without visible borders.
- Fill - responsible for the insides of the figure (what lies inside the border lines). This part can be painted over or, conversely, the fill can be removed and made empty (transparent to other shapes).
That is, a rectangle with a line and fill enabled will look like a filled (white) object surrounded by a line (black). A rectangle with a line but no fill will look “empty” inside.
The text settings window refers to the text that is written in the shape. In Visio, you can enter some text into each shape. Even on a line, you can press the “F2” button and edit its text. Closed shapes (circle, rectangle) are a convenient field for typing multi-line text. But the text on the line will be located in the middle of its name and cannot be moved. In this case, it is better to take a block of text and put it where you need it.
On the first tab of the window (“Font”), you can configure the font and its parameters. The most basic font settings (font, size, bold, italic, underlined) are available directly from the Visio toolbar, so you don’t have to climb into this window for this.
Font settings in Visio (shape)
Pay attention to the transparency setting. Here it is responsible precisely for the transparency of the text itself written in this font. That is, if you want to insert your copyright on top of the drawing, make its text transparent.
The Paragraph tab allows you to adjust the position of the text in a horizontal position. You can change the text alignment, set all sorts of paragraph indents and other things. Just like in Word!
Paragraph settings in Visio (for shape)
But on the “Text Block” tab, the parameters already affect the entire area in which we edit the text. Alignment here is responsible for the vertical position of the text in the block.
Text block customization options in Visio (for shape)
If we need a rectangle in which the text will be strictly in the middle, then we will need to turn off center alignment on both tabs. Transparency here also affects the transparency of the text block itself, and not the font. There are also field settings. By default, they are worth 4 points, but I always put them in 1 point: this way you can enter more text in the same text block, and enter the text very compactly on a small diagram or relay square.
The line settings here are also very extensive. You can select the line type and thickness. Moreover, you can choose the thickness from the preset ones or enter it by hand.
Linetype settings options in Visio
You can also enable the drawing of arrows at the beginning or end of a line. And if you drew a line in one piece (this is when, in the line drawing mode, you continue to draw it from the end of the previous one), then you can also adjust the corner rounding parameters. The same parameters will allow you to round the corners of a rectangle or polygon, if necessary.
And finally - filling. Any closed shape can be filled in different ways: with color or pattern.
Shape fill settings options in Visio
Pattern templates also contain all sorts of shading and gradients. I made fun of the rectangle as best I could: I set the line color to red, a gradient fill, and a translucent shadow that was filled with a checkered pattern. Wow! And that's all - standard Visio tools.
That is, most things in Visio can be drawn using a circle, a line and a square, using all sorts of fills and line properties. I even drew lenses: I attached a curved line to a straight line and chose to combine the shapes.
Grouping of figures and their position in the drawing according to “depth”.
In the “Shapes - Operations” menu there are very useful commands that are similar to AutoCAD’s trim, explode, break, join: shapes can be glued together, cut one after another, parsed into primitives and other things. For example, you can put a circle on a square, combine them and get a figure with a complex shape.
In the meantime, let's talk about grouping figures. This is the way Visio sees multiple shapes as one unit and the sizing and rotation squares appear alone on the overall shape. This is needed when we want to draw a complex object. Well, for example, a simplified electrical panel (a rectangle with a fill, circles as light bulbs and circles as buttons, and a rectangle with a blue fill as a display).
Drawing this once is not a problem. But if we need to draw a dozen of them and also drag them around the drawing, then sooner or later we will forget to select some lamp circles/buttons and they will go somewhere. This is why grouping of figures .
I was reminded of digital technology and how its inputs and outputs are indicated on the diagrams. A line-output, a square with a symbol and a rectangle with explanatory text are drawn. Something like that:
We compose a figure from individual parts
For one such thing, it took us as many as three figures: a line and two rectangles.
Let's imagine that we are carrying all this. They dragged it, forgot it - and it turned out that one of the rectangles had gone to hell somewhere:
Moving a figure without grouping: some of the elements have moved away
This does not suit us! We want comfort and convenience! Well: select all three shapes and press the right mouse button. Select the “group” option.
Shape grouping menu in Visio
After this, Visio sees our shape as one, and not a bunch of different ones. Now, if we drag it, it will move entirely.
Moving the grouped figure: now nothing will be lost
How can you access the text of individual rectangles inside such a shape? Do we really need to ungroup it back and then group it again? No! It’s even simpler: poke at such a figure with the mouse several times. First, the entire figure will be selected. And then its internal element, which is located under the mouse cursor, will be selected.
Now you can edit its parameters without ungrouping the shape. You can even move it inside the grouped shape if necessary!
Let's accumulate our gizmos two times, 4 pieces each. You can copy if you start dragging the shape while holding down the “Ctrl” key: then it moves and is immediately copied. This is convenient: you can immediately align the shapes to the grid.
Now let's play around with the rotation and reflection commands. Let's select our right shapes and flip them from left to right (around the vertical axis):
Shape flip mode options in Visio
Now some of our blanks have become like inputs, and some have become outputs:
We made two copies of the figure blocks - UGO entrance and exit
Let's draw the “body” of our block. Let's take a rectangle and draw a space around our conclusions. Oh, why is he closing everything to us?
Draw a rectangle (on top of the shapes)
There are two options here: you can set the fill of this rectangle to the “No fill” position. Then all that will remain of it is a line. I don’t like this option, because to the eye it seems that this logical block of ours is not a block, but something empty inside =)
Therefore, let's leave our rectangle as it is, but move it back along the Z axis by selecting the command “Shape - Send to Back” from the context menu (right mouse button on the figure):
Place the rectangle on the back of the drawing
Shapes in Visio can be sorted along the Z axis (closer to the eye and further away from the eye) in the order we need. Usually, each new figure is superimposed on top of the already drawn ones. If we are not satisfied with this, we can rearrange it so that it overlaps the others or, conversely, the others are in its background.
These z-positions of shapes apply within the document and within grouped shapes. That is, you can arrange the shapes in depth as you need and group them. And again place this grouped object in depth as you like.
This is what we got in the end. To make the picture complete, I also inserted a sum symbol into the background rectangle (Insert - Symbol), setting the font parameters so that the horizontal alignment of the paragraph was in the center, and the text block was aligned to the top edge. And since our figure is symmetrical, the symbol automatically stood where I wanted:
We drew a certain logical block (adder)
These are the techniques for working with shapes in Visio. We can say that they are relatively simple. I use shape grouping most often - it’s simply impossible to live without it!
Watermark mode in Visio. Drawing different floor plans.
When I wrote about setting page parameters (sheet sizes, scale), I mentioned there a certain background . So now the time has come to tell you about it in more detail, although just an example is simple to the point of laughter. Some document pages can be used as backgrounds for others! Of course, this is necessary for drawing any floor plans!
We take a page and draw a clean floor plan on it. I also included the names of the rooms here (and the plan refers to the post about renovations at relatives’ place on Vykhino). In the properties of the page, set its type as a background.
Set a page as a background for others in Visio
All such pages are automatically located at the end of the document, so as not to confuse those who work with them and not blow their minds.
Now we can create a new page and in the same window select our background page from the “Background” list. Visio will automatically draw a background for us, but we won’t be able to change it: that’s why it’s a background. Here I drew the electrical wiring elements:
The background is the same, but the plan of points is drawn
And here I drew the routes of the electrical wiring cables without changing the background. The page is different, but the background is the same.
The substrate is the same, but the route plan is drawn
The substrates can be nested inside each other, if necessary.
Various examples of drawing in Visio and how it was done.
This is where we end. Now I can show how I use Visio.
The simplest thing is to draw block diagrams in it. Here is a power supply diagram for one office that didn’t work out. But the scheme is cool!
Example of work in Visio: power distribution block diagram for two inputs
There is nothing complicated here: we took rectangles, set their line thickness, fill, and write the desired text in them, and then connect them together with lines of different thicknesses. I also drew rectangles for the thick tires, because a thick line will have rounded edges, and I don’t want that.
The entertainment is a little more complicated. We make labels for jars of household chemicals. Let's take the rectangles, set the scale to 1:1 and draw labels of a size that is convenient for us. Next, let’s go into the line properties and set the rounded edges:
Example of working in Visio: labels for jars
All that remains is to print it on colored paper and stick it on. Due to the outline line and different font sizes, our labels turned out to be very stylish. And all this - Visio! No Photoshop or Corel Draw!
Example of working in Visio: sticking labels on jars
The meat is a little more complex. I wanted to paint IO for my first project on Logo:
Example of work in Visio: pinout drawing of Siemens Logo controller modules
I took photos of Logo modules from the Internet. Visio allows you to insert an image and not only change its size, but also crop it as needed. I carefully cropped the photos of Logo modules so that the edges of the object exactly matched the edges of the modules picture.
Then all that remained was to cram rectangles with the necessary inscriptions and group it all into large blocks: the main one and expansion modules. And write the necessary texts! The names of the signals make it clear what kind of project this is. His time will come someday!
And here is the meat from a project to reassemble country wiring onto wire trays (for a friend’s relatives):
Example of working in Visio: drawing tray routes
Now you’ll laugh, because the tray is shown here in the form of rectangles filled with a grid! The fastening for the tray is made of a rectangle and three circles (one is filled in the center - this is a type of fastening pin). They are all grouped and these mounts are carried around as a single figure. And for the callouts, a Visio object is used. It’s called “Callout” and is also included in the standard sets of figures.
And this is an atrocity with the project of a slipway for assembling shields (it took about an hour - this is a long time by Visio standards):
An example of working in Visio: drawing of the components of a slipway for assembling panels
The drawing is made from a bunch of grouped blocks: fastenings, one shield panel with two supporting profiles. I measured them and then arranged them on the drawing to scale to check the alignment of the fasteners. It worked out! =)
Well? Do you still want to torture AutoCAD/Photoshop/Corel for simple diagrams or printouts? I no longer have it, and I wish the same for you!
Learning to read circuits with transistors
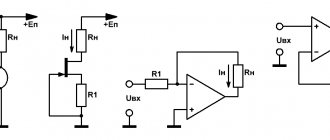
In this drawing we see transistor VT1 and motor M1. To be specific, we will use a 2N2222 type transistor, which operates in electronic key mode.
In order for the transistor to open, you need to apply a positive potential to its base relative to the emitter - for n–p–n type; for the p–n–p type, a negative potential must be applied relative to the emitter.
The SA1 button is fixed, that is, it retains its position after pressing. M1 DC motor.
In the initial state, the circuit is open by contacts SA1. When you press the SA1 button, several paths for current flow are created. The first path is “+” GB1 – contacts SA1 – resistor R1 – base-emitter junction of transistor VT1 – “-” GB1. Under the influence of current flowing through the base-emitter junction, the transistor opens and a second current path is formed - “+” GB1 – SA1 – relay coil K1 – collector-emitter VT1 – “-” GB1.
Having received power, relay K1 closes its open contacts K1.1 in the motor circuit M1. Thus, a third path is created: “+” GB1 – SA1 – K1.1 – M1 – “-” GB1.
Now let's summarize everything. In order to learn to read electrical circuits, at first it is enough just to clearly understand the laws of Kirchhoff, Ohm, electromagnetic induction; methods of connecting resistors, capacitors; You should also know the purpose of all elements. Also, at first, you should assemble those devices for which there are the most detailed descriptions of the purpose of individual components and assemblies.
My course, very useful for beginners, How to Read Electrical Circuits and Create Electronic Devices, will help you understand the general approach to developing electronic devices from drawings, with many practical and visual examples. After completing this course, you will immediately feel that you have moved from a beginner to a new level.